
Influenza in Sweden – Season 2022–2023
Summary
During the 2022–2023 season, Sweden experienced co-circulation of influenza A(H1N1)pdm09, influenza A(H3N2) and influenza B/Victoria. The season began in week 48 when the number of laboratory-confirmed influenza A cases began to increase. The peak was reached in week 52. The influenza peak overlapped with peaks in reported COVID-19 and respiratory syncytial virus (RSV) cases. As a result, excess all cause mortality was observed between week 50, 2022, and week 2, 2023 among those aged 65 years and older. During the first three weeks of 2023, the number of cases of influenza A decreased quickly, as did all-cause mortality. This was followed by an increase of influenza B/Victoria cases during February and March, which primarily affected younger age groups. The influenza season ended in week 18.
Testing and notified cases
During the 2022–2023 season, approximately 325,000 samples were analysed for influenza, which is higher than any previous season except 2021–2022. The introduction of combined molecular tests for SARS-CoV-2, influenza, and RSV during the COVID-19 pandemic has led to a surge in performed influenza analyses and to a different demography of both tested individuals and laboratory-confirmed cases. In total, 23,015 laboratory-confirmed influenza cases were reported, of which 78 percent were influenza A and 22 percent were influenza B. The proportion of positive samples over the whole season was 7 percent. The median age was 51 years for individuals with laboratory-confirmed influenza A and 28 years for influenza B. Of subtyped samples, 53 percent were A(H1)pdm09 and 47 percent were A(H3).
Influenza among people 0–39 years of age
During the season, the notification rate of laboratory-confirmed influenza was high among children aged 0–4 years compared to the five previous seasons. This was likely due to a combination of increased testing related to the simultaneous RSV peak, as indicated by data regarding testing rates, and high levels of transmission in this age group, shown in calls for medical advice regarding fever in this age group. The number of influenza cases in intensive care among children 0–4 years (34 patients) was also substantially higher than during the previous four epidemic seasons (average 12 patients per season). Because of lower-than-usual spread of influenza during the COVID-19 pandemic, many younger children had not yet been exposed to influenza, meaning this age group likely saw high transmission during both influenza A and B dominant periods of the season.
Similarly, age groups 5–14 years and 15–39 years had higher rates of notification of laboratory-confirmed influenza and a higher number of patients in intensive care compared with the previous five seasons. Half of patients 5–39 years of age in intensive care had influenza B.
Cluster of severe influenza B cases
During March 2023, a small number of epidemiologically linked cases of influenza B with severe complications were reported among adolescents, prompting activities at the regional and national level, including a national investigation. The investigation aimed to identify other similar cases, as well as assess whether the number of influenza B cases with severe complications was higher than expected, and whether there was any common contributing cause beyond influenza infection or any viral factors associated with the observed severe complications. Thus far, the investigation has not identified any virological or other explanation for the cases, beyond high influenza transmission. Although severe cases are expected during influenza epidemics, the cluster remains unusual. See Appendix 1, Investigation of severe complications of influenza B among adolescents.
Severe outcomes of influenza infection
A total of 353 patients in intensive care with laboratory-confirmed influenza were reported during the season. The highest number of admissions to intensive care was in week 52 (69 patients) and was higher than the peaks of the previous five seasons. A majority (80 percent) of the patients with influenza in intensive care during 2022–2023 were infected with influenza A. Among the 43 samples subtyped, there was an even distribution of influenza A(H1)pdm09 and influenza A(H3).
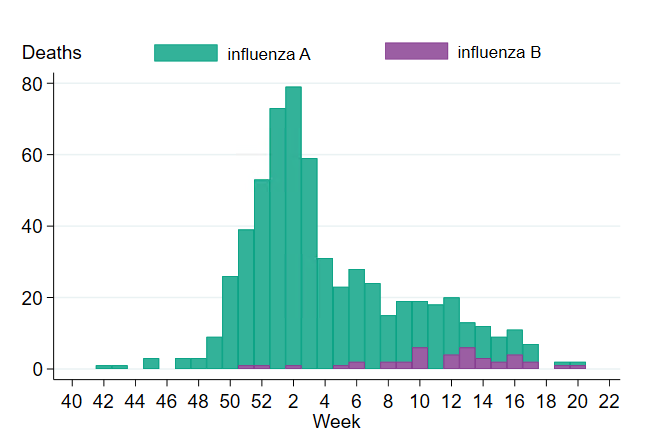
A total of 603 confirmed cases were reported to have died within 30 days of influenza diagnosis, with a median age of 83 years. The weekly number of deaths reached the highest numbers in weeks 1 and 2, 2023, with 73 and 79 deaths, respectively. Deaths occurred mainly during the influenza A-dominant period of the season, and 93 percent of the deaths had influenza A. Among influenza cases, 3 percent of influenza A cases and less than one percent of influenza B died within 30 days of diagnosis. Among persons aged 65 years and older with laboratory-confirmed influenza A or B, approximately 8 percent died within 30 days.
Sentinel surveillance
In sentinel surveillance, 77 of 322 analysed samples were positive for influenza (24 percent). Of these, 61 were influenza A (79 percent) and the remaining 16 samples were influenza B/Victoria. Of the influenza A positives, 59 percent were influenza A(H3), with the rest being influenza A(H1)pdm09.
Virus characterisation
A selection of influenza-positive samples received from clinical laboratories and collected through sentinel surveillance are further analysed at the PHAS. During the season, the HA gene of 285 viruses has been characterised for genetic group affiliation, including 89 A(H3N2), 101 A(H1N1)pdm09, and 95 B/Victoria influenza viruses. The majority of influenza A(H3N2) viruses belonged to the same genetic subgroup (3C.2a1b.2a.2a) as the viruses included in the northern hemisphere vaccines 2022–2023. Influenza A(H1N1)pdm09 viruses that were analysed belonged to subgroups 5a.2a and 5a.2a.1, which are poorly recognised by human post-vaccination sera raised against the vaccine viruses (subgroup 5a.2) indicating mismatch. As a result, the A(H1N1)pdm09 component for the northern hemisphere vaccines 2023–2024 has been changed to subgroup 5a.2a.1. Characterised B/Victoria-viruses belonged to genetic subgroup V1A.3a.2, which is the same genetic subgroup as the vaccine virus.
The NA gene of 286 viruses was characterised. In 285 of these, no amino acid substitutions previously shown to result in reduced or highly reduced inhibition by oseltamivir or zanamivir were detected. One (H1N1)pdm09 isolate carried a minority variant of amino acid substitution N295S, which is associated with reduced or highly reduced inhibition for oseltamivir. No decreased baloxavir susceptibility was detected in the PA gene of 277 viruses analysed.
Influenza vaccination
This season, the influenza vaccination campaign began on November 8, 2022, but vaccination of people living in care homes began in the end of October. Until December 5th, risk groups and health care workers were prioritized.
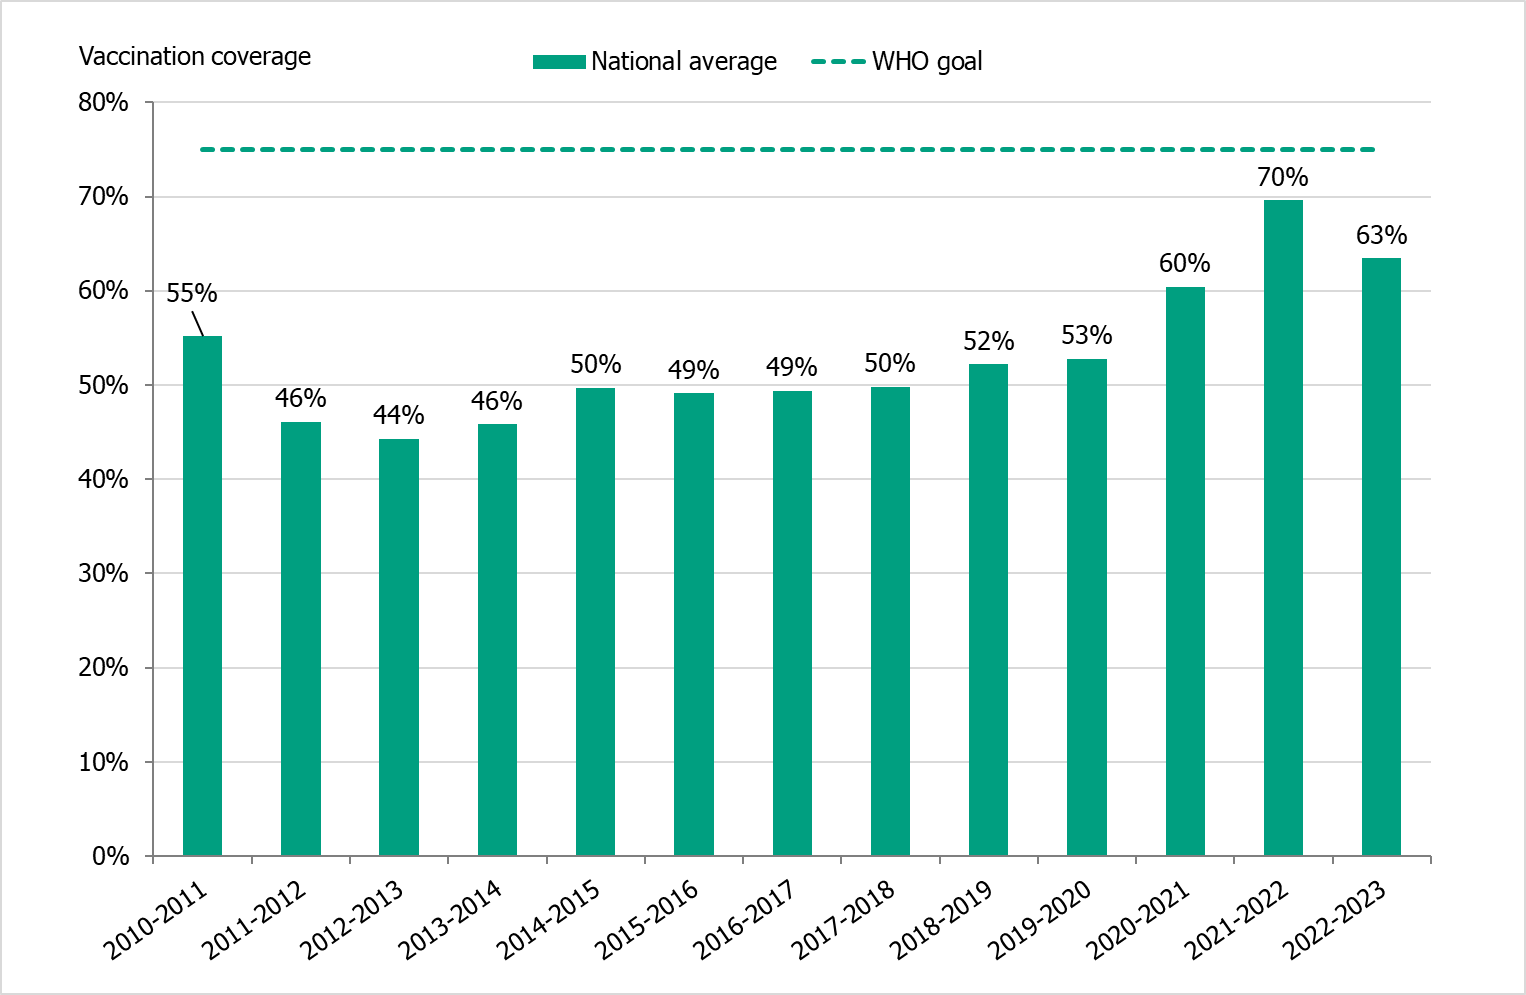
Vaccination coverage against influenza among persons aged 65 years or older was estimated at 63 percent, which is higher than the six seasons before the COVID-19 pandemic (49–53 percent), but lower than the 2021–2022 season (70 percent).
Sammanfattning
Säsongen 2022–2023 var blandad med spridning av influensa A(H1N1)pdm09, influensa A(H3N2) och influensa B/Victoria. Den startade vecka 48 då antalet laboratoriebekräftade influensa A-fall började öka. Toppen nåddes vecka 52. Influenstoppen överlappade med toppar i rapporterade fall av covid-19 och RS-virus. Som ett resultat sågs en överdödlighet mellan vecka 50 och vecka 2 bland personer 65 år och äldre. Under de första tre veckorna av 2023 minskade antalet fall av influensa A snabbt, liksom överdödligheten. Detta följdes av en ökning av fall av influensa B/Victoria under februari och mars, vilket främst drabbade yngre åldersgrupper. Influensasäsongen avslutades vecka 18.
Provtagning och bekräftade fall
Under säsongen 2022–2023 analyserades cirka 325 000 prover för influensa, vilket är fler än någon tidigare säsong förutom 2021–2022. Under pandemin av covid-19 infördes kombinerade molekylära tester för SARS-CoV-2, influensa och RS-virus, och det har lett till en ökning av utförda influensaanalyser och en förändrad demografi när det gäller både provtagna individer och laboratoriebekräftade fall. Totalt rapporterades 23 015 laboratoriebekräftade influensafall, varav 78 procent var influensa A och 22 procent influensa B. Andelen positiva prover över hela säsongen var 7 procent. Medianåldern för individer med laboratoriebekräftad influensa A var 51 år och 28 år för influensa B. Av subtypade influensa A-prover var 53 procent influensa A(H1)pdm09 och 47 procent var influensa A(H3).
Influensa bland personer 0–39 år
Bland barn 0–4 år rapporterades många laboratoriebekräftade influensafall per 100 000 invånare, jämfört med de fem föregående säsongerna. Detta berodde sannolikt på en kombination av ökad provtagning på grund av den samtidiga RS-virustoppen, vilket testningsdata tyder på, och hög smittspridning i denna åldersgrupp, vilket syns i samtal till 1177 om små barn med feber. Antalet barn 0–4 år som vårdades inom intensivvården (34 patienter) var också betydligt högre än under de föregående fyra säsongerna med influensaspridning (i genomsnitt 12 patienter per säsong). På grund av lägre influensaspridning under covid-19-pandemin hade många yngre barn ännu inte exponerats för influensa, vilket innebär att denna åldersgrupp sannolikt smittades i hög grad under både den influensa A och B-dominerade perioden av säsongen.
Även i åldersgrupperna 5–14 år och 15–39 år sågs ett högre antal laboratoriebekräftade fall av influensa per 100 000 och fler patienter som vårdades inom intensivvården, jämfört med de fem föregående säsongerna. Hälften av patienterna 5–39 år inom intensivvården hade influensa B.
Kluster av allvarliga influensa B-fall
Under mars 2023 rapporterades bland ungdomar ett litet antal epidemiologiskt kopplade fall av influensa B med allvarliga komplikationer, vilket ledde till aktiviteter på regional och nationell nivå, inklusive en nationell utredning. Syftet med utredningen var att identifiera andra liknande fall samt bedöma om antalet influensa B-fall med allvarliga komplikationer var högre än förväntat, och om det fanns någon gemensam bidragande orsak i detta kluster, utöver influensainfektion, eller om några virusfaktorer var kopplade till komplikationerna. Hittills har utredningen inte identifierat någon virologisk eller annan förklaring till fallen, utöver hög smittspridning. Även om allvarliga fall förväntas under influensaepidemier, är klustret fortfarande ovanligt. Se Appendix 1, Investigation of severe complications of influenza B among adolescents.
Allvarliga utfall av influensainfektion
Totalt rapporterades 353 patienter med laboratoriebekräftad influensa inom intensivvården under säsongen. Det högsta antalet nyinläggningar var vecka 52 (69 patienter), och det var högre än topparna under de fem föregående säsongerna. En majoritet (80 procent) av de intensivvårdade patienterna med influensa under 2022–2023 hade influensa A. Bland de 43 subtypade proverna sågs en jämn fördelning av influensa A(H1)pdm09 och influensa A(H3).
Totalt 603 personer med bekräftade influensa rapporterades ha avlidit inom 30 dagar efter diagnosen, med en medianålder på 83 år. Flest avled under vecka 1 och 2 med 73 respektive 79 personer. Dödsfallen inträffade främst under den influensa A-dominerande perioden av säsongen, och 93 procent av de avlidna hade också influensa A. Bland personer med bekräftad influensa hade 3 procent av dem med influensa A, och mindre än 1 procent av personerna med influensa B, avlidit inom 30 dagar efter diagnosen. Bland personer 65 år och äldre med laboratoriebekräftad influensa A eller B hade cirka 8 procent avlidit inom 30 dagar.
Sentinelövervakning
Inom sentinelövervakningen var 77 av 322 analyserade prover positiva för influensa (24 procent). Av dessa var 61 influensa A (79 procent) medan de återstående 16 proverna var influensa B/Victoria. Av de influensa A-positiva var fördelningen 59 procent influensa A(H3) och 41 procent influensa A(H1)pdm09.
Viruskaraktärisering
Ett urval av influensapositiva prover som tas emot från kliniska laboratorier eller samlas in genom sentinelövervakningen analyseras vidare vid Folkhälsomyndigheten. Under säsongen karaktäriserades hemagglutiningenen (HA) hos 285 stammar med efterföljande analys av genetisk grupptillhörighet. Bland dessa ingick följande influensastammar: 89 influensa A(H3N2)-stammar, 101 influensa A(H1N1)pdm09-stammar och 95 influensa B/Victoria-stammar. Majoriteten av de karaktäriserade influensa A(H3N2)-stammarna tillhörde samma genetiska subgrupp (3C.2a1b.2a.2a) som vaccinstammen för norra halvklotet 2022–2023. Karaktäriserade influensa A(H1N1)pdm09-virus tillhörde subgrupp 5a.2a och undergrupp 5a.2a.1. I humanserologiska analyser med post-vaccinationsserum (efter vaccination med de vaccinstammar som rekommenderades för norra halvklotet 2022–2023) påvisades dåligt skydd mot dessa grupper och därför har vaccinstammen i vaccinen för 2023–2024 bytts till undergrupp 5a.2a.1. Karaktäriserade B/Victoria-virus tillhörde den genetiska undergruppen V1A.3a.2, vilket är samma genetiska undergrupp som vaccinstammen.
Neuraminidas-genen (NA) för 286 influensastammar karaktäriserades. I 285 av dessa upptäcktes inga aminosyrasubstitutioner som tidigare visat sig resultera i reducerad eller mycket reducerad känslighet för neuraminidashämmare. Ett influensa A(H1N1)pdm09-isolat bar dock på en minoritetsvariant av aminosyrasubstitution N295S, som är associerad med reducerad eller mycket reducerad känslighet för neuraminidashämmare. Ingen minskad känslighet för baloxavir upptäcktes i PA-genen (polymerase acidic subunit) hos 277 analyserade virus.
Influensavaccination
Höstens allmänna vaccinationsinsatser mot säsongsinfluensa inleddes den 8 november 2022 (vecka 45). Vaccination av personer på särskilda boenden för äldre påbörjades i slutet av oktober. Fram till den 5 december prioriterades riskgrupper tillsammans med vård- och omsorgspersonal.
Vaccinationstäckningen mot influensa bland personer 65 år och äldre uppskattas till 63 procent, vilket är högre än de sex säsongerna före covid-19-pandemin (49–53 procent) men lägre än säsongen 2021–2022 (70 procent).
About this publication
This report describes the monitoring systems for influenza in use during the 2022–2023 winter season and the results of both epidemiological and virological surveillance. Data are also compared to previous influenza seasons.
The report has been prepared for the World Health Organization (WHO) as part of the Public Health Agency of Sweden’s function as a National Influenza Centre (NIC).
Annual reports in English about the influenza seasons in Sweden have been available since 1997, and those from 2014–2015 onward can be found on the Public Health Agency’s website (suggested search “Influenza in Sweden”) (1).
Public Health Agency of Sweden
Lena Dillner
Head of Unit
Unit for Laboratory Surveillance of Viral Pathogens and Vaccine Preventable Diseases
Anneli Carlander
Head of Unit
Unit for Coordination and Surveillance of Seasonal Viruses
Influenza surveillance in Sweden
Influenza epidemics recur in Sweden during winter, with a range of effects depending on the characteristics of the circulating viruses and the level of immunity in different age groups. In order to get an overall picture of on-going influenza activity and to remain prepared in case of a pandemic, the Public Health Agency of Sweden (Folkhälsomyndigheten) (PHAS) has a number of different epidemiological reporting systems for influenza ranging from the collection of data from different healthcare providers to the analysis of web searches.
Virological surveillance provides additional data on occurrence and provides detailed information on typing and resistance in circulating strains. Viruses are typed as influenza A or B by regional laboratories in real time during the influenza season, and some laboratories also determine the subtype for influenza A. Throughout the season, a selection of viruses from around the country are characterised at the PHAS laboratory. PHAS performs real-time PCR, whole genome sequencing and NAI (neuraminidase inhibition assay) with regard to subtype and lineage, genetic group affiliation, vaccine similarity, and sensitivity to antiviral drugs. Viruses are also isolated and sent to the WHO Collaborating Centre (WHOCC) in London for further characterisation and to provide a basis for vaccine strain selection. When new strains of influenza virus emerge, reference methods for diagnostics are established at the PHAS and shared with all microbiological laboratories in Sweden.
During the influenza season, the PHAS condenses national and international data into a detailed weekly bulletin that is published on the agency’s website (2). The bulletin provides timely analysis and assessment of the current situation in Sweden and abroad and has a wide readership.
Updates to national policies and recommendations
During the 2022–2023 season, updated web-based information about vaccinations and influenza was published in August 2022. The revision included updated recommendations about prioritization for vaccination, reinforced vaccines for people in long-term care facilities, and information about co-vaccination for influenza and COVID-19 (3).
Current recommendations for influenza vaccination of risk groups (in Swedish)
Surveillance 2022–2023
The surveillance pyramid below illustrates the different outcomes and levels of severity and the corresponding surveillance systems for individuals infected with influenza (Figure 1), ranging from the large number of infected individuals to the small number who die due to influenza infection. Table 1 describes the data collection systems that the PHAS used to monitor influenza activity at the various levels of the pyramid in Sweden during the 2022–2023 season and shows a summary of the results of each system. Each system is described further at the start of each section of this report. The COVID-19 pandemic continued to impact influenza surveillance during the season, with changes to healthcare seeking and testing behaviour. The integration of influenza and COVID-19 surveillance is ongoing, along with the integration of RSV surveillance.
Table 2 shows at which week each system, as applicable, crossed the threshold for epidemic start and when it reached its peak notation, as well as the maximum intensity level measured by the system during the season. When possible, quantitative thresholds for epidemic start and end, as well as intensity levels (low, medium, high, very high) are calculated based on data from previous seasons using the moving epidemic method (4). Some intensity thresholds have been affected by increased testing and are therefore likely to inadequately reflect seasonal intensity.
Figure 1. The surveillance pyramid showing possible outcomes of an influenza infection and the surveillance systems at each level.
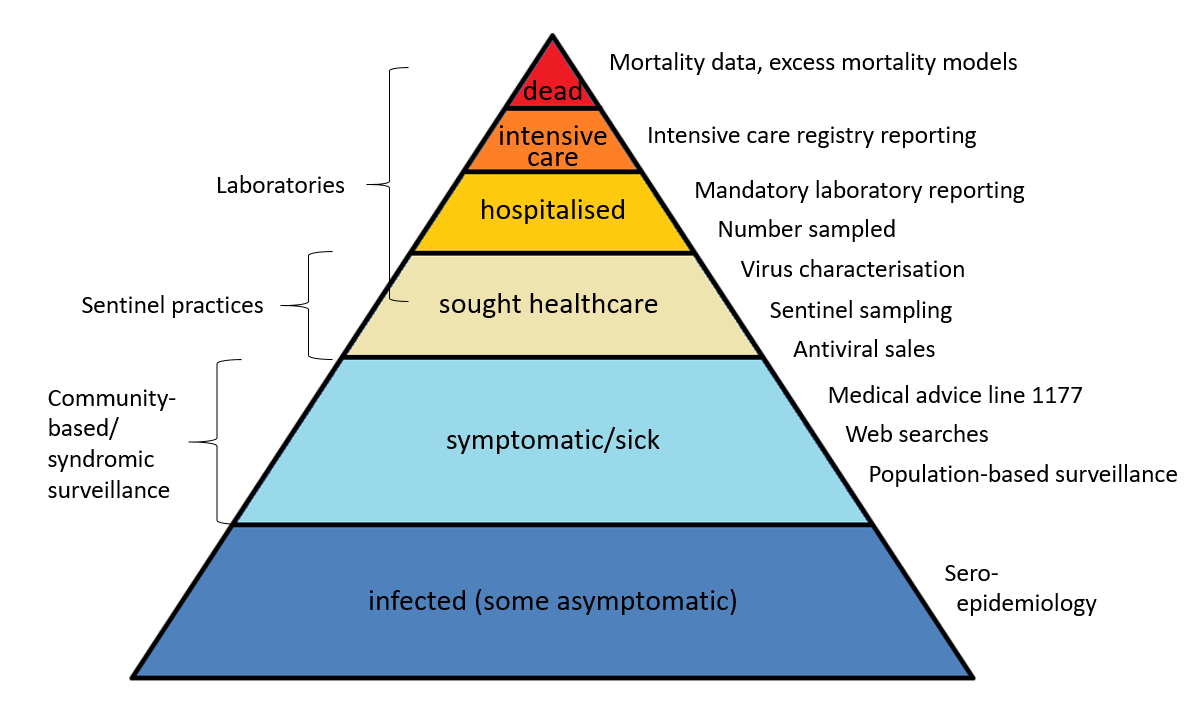
Please note that mandatory laboratory reporting, number sampled and virus characterisation includes all levels from sought healthcare and above, if patients are sampled.
| Reporting system/method | Implementation | What does the system/method show? | Results (2022–2023) | |
|---|---|---|---|---|
| Mandatory laboratory reporting of identified influenza cases including sub-/lineage typing results if available. | Legal obligation for all laboratories to report case-based influenza diagnoses along with full patient identity in the web-based reporting system – SmiNet – in accordance with the Communicable Diseases Act. | Number of laboratory-confirmed cases of influenza A and B together with age, gender, and geographical distribution. Influenza virus and sub-/lineage type distribution. | 17,848 laboratory-confirmed cases of influenza A and 5,167 cases of influenza B. In total, 78 percent influenza A and 22 percent influenza B. Of influenza A cases subtyped, 53 percent A(H1)pdm09 and 47 percent A(H3). Of Influenza B cases with determined lineage, 0 percent B/Yamagata and 100 percent B/Victoria. | |
| Voluntary laboratory reporting of samples tested | Voluntary reporting of the number of samples tested with aggregated data sent via email. | Number of tested and proportion of samples tested that are positive | 324,112 samples tested with 7 percent positive. | |
| Antiviral sales | Weekly data from the Swedish eHealth Agency | Number of packages of oseltamivir and zanamivir sold by type of sale, including prescriptions and health care requisitions. | 17,839 packages of oseltamivir and zanamivir | |
| Voluntary clinical reporting of laboratory-confirmed influenza cases (all types) in intensive care (SIRI) | Collaboration with the Swedish Intensive Care Registry (SIR). Treating physicians in intensive care units voluntarily report clinical information about patients with laboratory-confirmed influenza. | Severity of infections by different influenza subtypes and impact on the intensive care units. | 353 laboratory-confirmed cases of influenza were reported from SIRI. Of those, 281 were reported as influenza A and 72 were influenza B. | |
| Excess mortality models | Weekly data on the aggregated number of deaths in Sweden, by age group, is sent from the Swedish Tax Agency to the Public Health Agency and analysed with a statistical model. | All-cause mortality (EuroMoMo model) | Excess mortality was seen from week 50, 2022, to week 2, 2023, in the total population and particularly in the age group 65 years and older. | |
| Deaths within 30 days | Weekly data on date of death are sent from the Swedish Tax Agency to the Public Health Agency, linked to influenza registries, and analysed intermittently. | Death within 30 days of influenza diagnosis | 603 of 23,082 persons with a laboratory-confirmed influenza diagnosis died within 30 days of diagnosis, of which 93 percent were influenza A. Most (90 percent) were aged 65 years and older. | |
| Sentinel sampling | Samples taken by Primary Care GPs from some patients who present with influenza-like illness (ILI), as well as some patients with acute respiratory illness (ARI), are analysed by the Public Health Agency for influenza (and SARS-CoV-2). | The proportion of sentinel patients with ILI or ARI who have an influenza infection (see also virus characterisation below). | 322 samples were analysed, of which 77 (24 percent) tested positive for influenza. Of these, 79 percent were influenza A and 21 percent influenza B, of which all were B/Victoria, (0 percent B/Yamagata). Of influenza A positives, 53 percent were influenza A(H3) and 47 percent were A(H1)pdm09. In total, 81 percent of the patients had clinical symptoms of ILI. |
|
| Genotypic and phenotypic characterisation | Continual genotypic and phenotypic analysis of a selection of influenza-positive laboratory and sentinel samples. | Genetic group affiliation, genetic vaccine similarity, and susceptibility to antiviral drugs among the viruses selected for characterisation. | In total, genetic group affiliation has been determined for 285 viruses. The majority (71 percent) of the A(H3N2) viruses analysed belonged to the same genetic subgroup as the vaccine viruses included in the northern hemisphere vaccines 2022–2023. The characterised A(H1N1)pdm09 viruses belonged to a subgroup poorly recognised by human post-vaccination sera raised against the vaccine viruses. B/Victoria viruses belonged to the same genetic group as the vaccine viruses. Genotypically, no reduced sensitivity to oseltamivir or zanamivir was identified (in 90 A(H3N2), 101 A(H1N1)pdm09, and 94 B/Vic analysed viruses) or to baloxavir (in 87 A(H3N2), 100 A(H1N1)pdm09, and 90 B/Vic analysed viruses). In one A(H1N1)pdm09 sample the N295S substitution was detected as a minority variant. N295S in NA is associated with reduced inhibition by oseltamivir. No reduced sensitivity to zanamivir was detected in this sample. The amino acid substitution S31N in the matrix gene conferring resistance to amantadine was identified in all 199 analysed influenza A viruses. | |
| Vaccination coverage | Periodic collection of coverage data from each region. | Vaccination coverage per age group. | 63 percent coverage among those 65 years or older | |
| Web Search (Webbsök, data from medical advice site 1177.se) | An automated system that uses search data from the national medical advice site 1177.se. The numbers of searches for influenza and influenza symptoms are entered into a statistical model that estimates the proportion of patients with ILI visiting general practitioners. | Estimates the proportion of patients with ILI. | Between week 27, 2022, and week 26, 2023, a total of 291,966 queries related to influenza were entered, which was 4 percent of the total number of queries on the 1177.se website. | |
| National medical advice telephone line 1177 (Hälsoläge) | The weekly aggregated data on the primary reason for contacting the medical advice line (phone number 1177) and the age groups of the patients are reported to the Public Health Agency. | Symptoms recorded as the primary reason for contacting the medical advice line by age group (adults and children).This data system was unavailable Feb–Jun 2023. | During the peak week (week 51, 2022), 14 percent of calls were due to fever in children (0–17 years of age). For children under 4 years the peak week was also week 51 with 41 percent of the calls. | |
| System | Start | Peak | End | Max intensity |
|---|---|---|---|---|
| Laboratory-based surveillance (number of cases) | 48 | 52 | 18 | High (b) |
| Laboratory-based surveillance (percentage positive) |
50 | 52 | 15 | (a) |
| Laboratory-confirmed influenza cases in intensive care (SIRI) | (a) | 52 | (a) | High |
| Excess mortality | 50 | 1 | 2 | Significant excess mortality |
| Sentinel sampling, positives | (a) | 51 | (a) | (a) |
| Web Search (Webbsök) | 47 | 51-52 | 1 | Medium |
| Telephone Advice Line (1177) | 43 | 51 | (c) | Very high |
(a) Epidemic thresholds/intensity levels not assigned.
(b) Max intensity based on expert evaluation of quantitative levels beacuse intensity thresholds were affected by increased testing and inadequately reflect seasonal intensity.
(c) This data system was unavailable Feb-Jun 2023 so no end of season could be calculated.
Laboratory-based surveillance
Testing for influenza
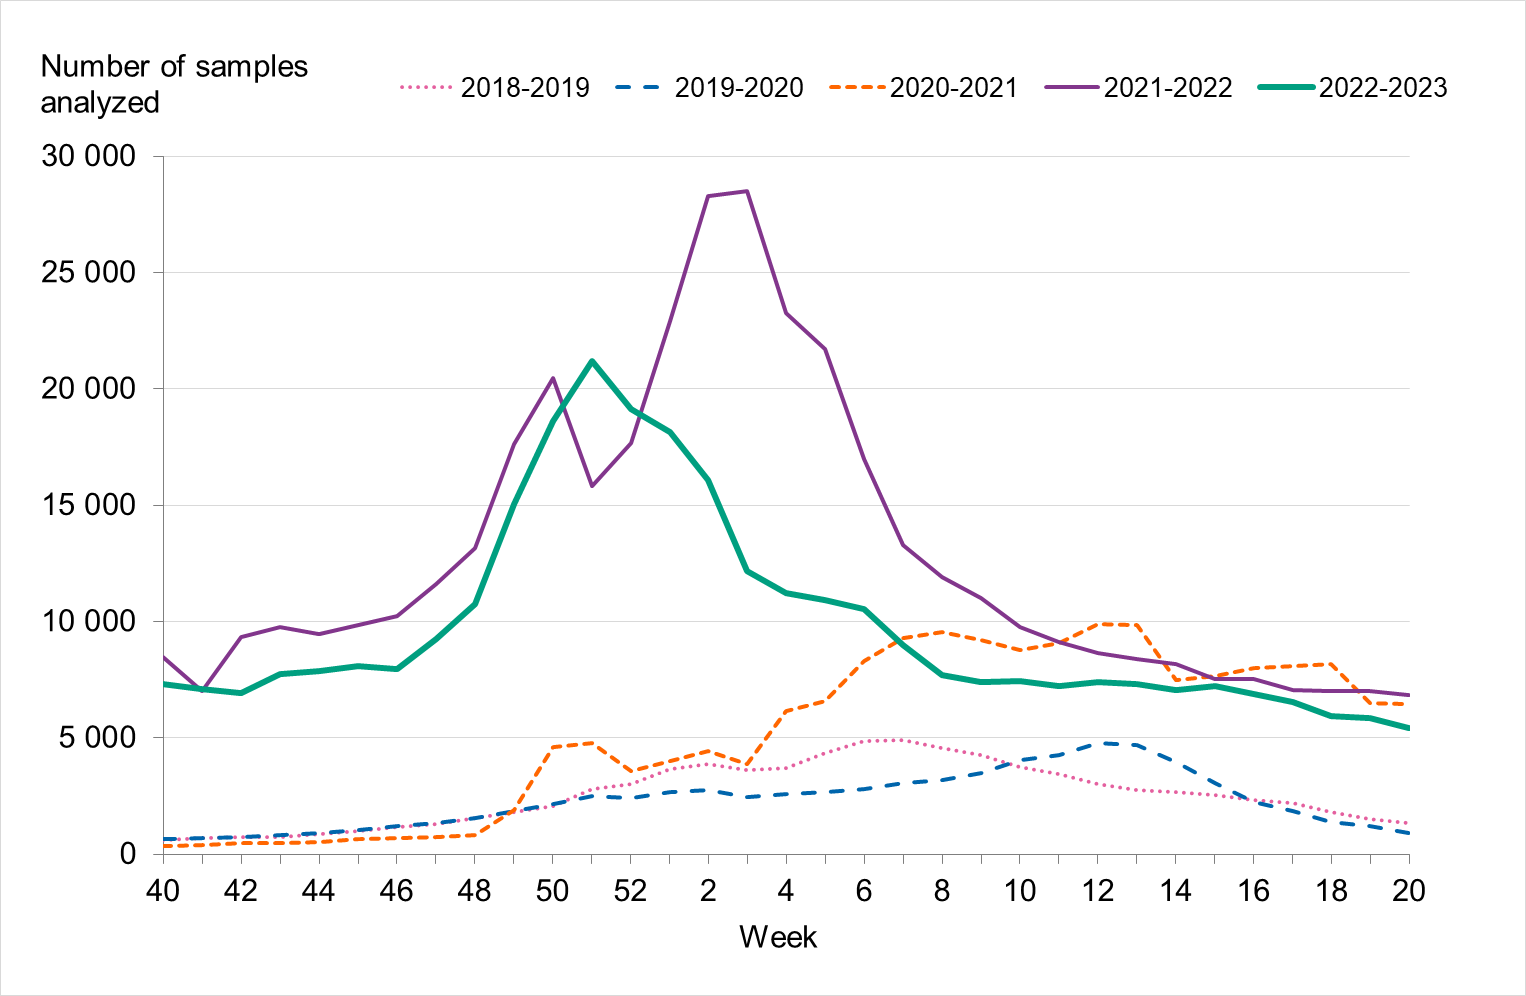
During the 2022–2023 season, approximately 325 000 samples were analysed for influenza, which was higher than previous seasons except 2021–2022, see Figure 2. The highest number of weekly samples were analysed in weeks 50–52, 2022 (approximately 18,000–21,000 samples per week). This period also saw the season’s highest levels of influenza, COVID-19, and RSV cases.
Testing for influenza is performed using molecular methods, predominately PCR-based tests. Data on the total number of samples analysed are reported voluntarily by the laboratories to the PHAS. As less expensive and faster PCR systems for influenza testing have become available, testing has expanded from mainly hospital settings to also include outpatient care, including primary care. The introduction of combined molecular tests for SARS-CoV-2, influenza, and RSV during the COVID-19 pandemic has led to a surge in testing and to a different demography of tested individuals. People with milder symptoms have been tested to a larger extent than before the COVID-19 pandemic, particularly older children and adults under 65 years of age (conclusion based on a subset of RSV-denominator data that are disaggregated by age group, not shown). In turn, more laboratory-confirmed cases have been reported among these age groups than in seasons before the COVID-19 pandemic, see also Age and sex distribution of cases.
Figure 2. Number of samples analysed for influenza data per week, per season, 2018–2023.
Laboratory-confirmed influenza cases
During the fall of 2022, the number of laboratory-confirmed influenza cases was very low, but cases began to increase as November progressed. The epidemic started in week 48 (Figure 3), as determined through threshold values set (see section on Influenza surveillance in Sweden), which was within the normal period and the same week as the previous season. The number of influenza A cases increased quickly during the first weeks of December and peaked in week 52 with 3,308 cases reported. Around this time, RSV and COVID-19 also reached the highest levels for the season, see Figure 4.
During the first three weeks of 2023, the number of cases of influenza A decreased quickly. This was followed by an increase of influenza B cases during February that reached a peak in week 12, although the peak was smaller than that of influenza A. The influenza epidemic ended in week 18, but sporadic cases continued to be reported through the summer.
In total, 23,015 laboratory-confirmed influenza cases were reported between week 40, 2022, and week 20, 2023, of which 17,848 cases (78 percent) were influenza A and 5,167 cases (22 percent) were influenza B, see Table 3. Because of increased sampling, the number of reported cases per week or in total was not comparable with the seasons before the COVID-19 pandemic. During the first weeks of the 2022–2023 season, the sampling was similar to that of the 2021–2022 season. However, after reaching its highest level in December, sampling decreased, see Figure 2, likely as an effect of changes in testing strategy for SARS-CoV-2.
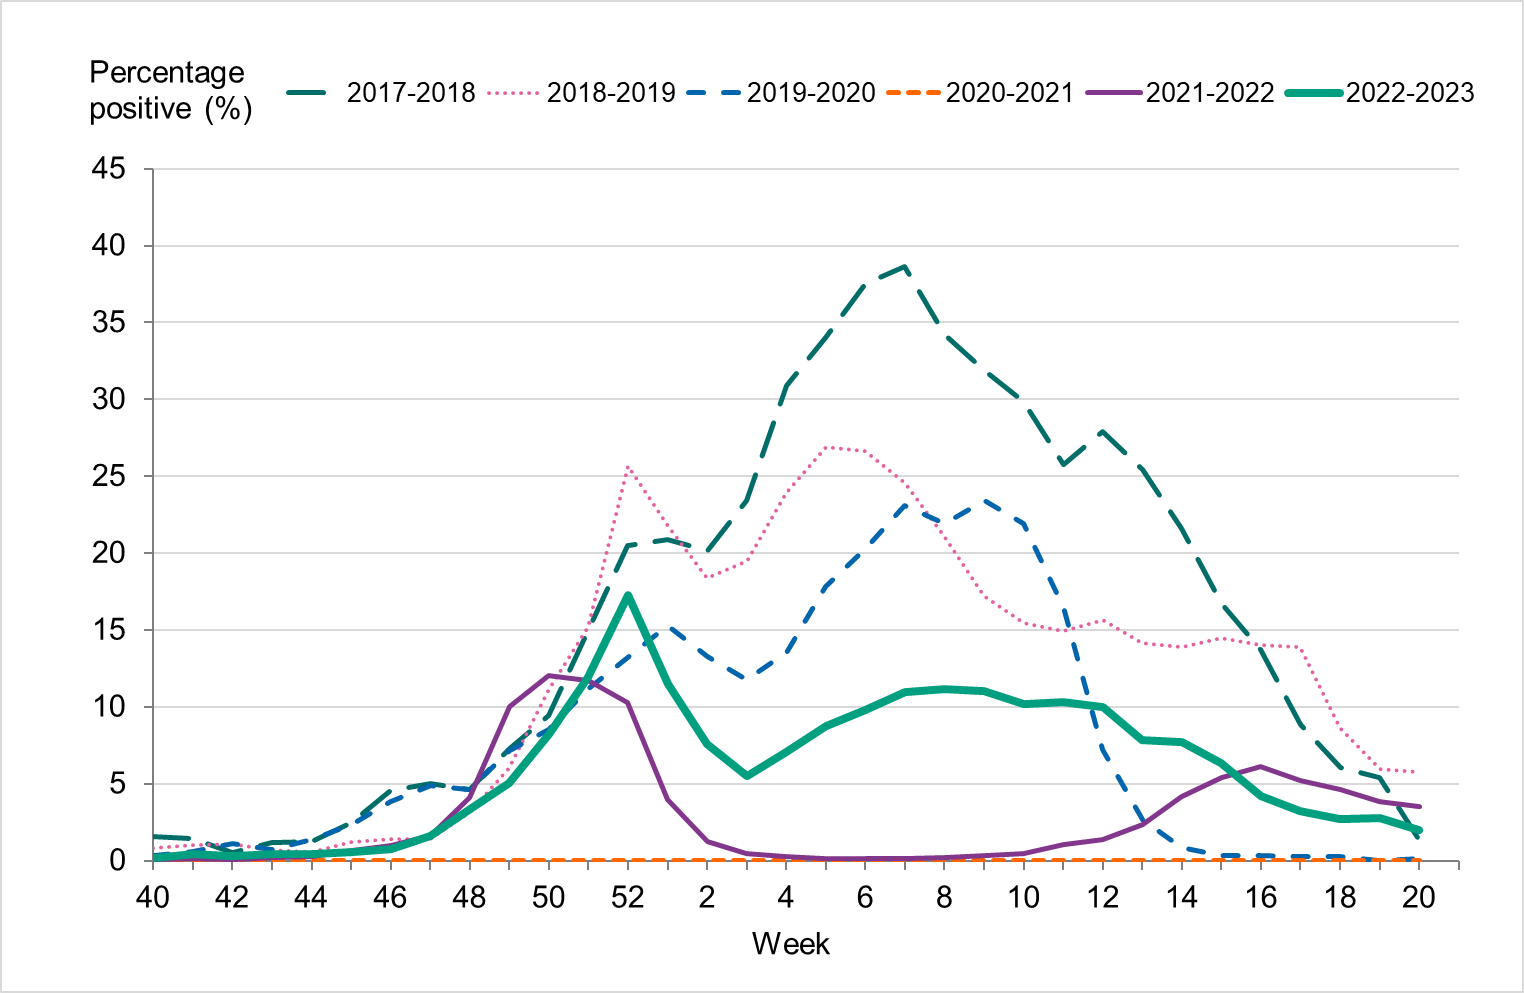
Overall, 7 percent of the samples taken during the season were positive for influenza, which was lower compared to seasons before the COVID-19 pandemic, reflecting the high levels of testing, see Table 3. The highest percentage of positive samples was seen in week 52 at 17 percent, see Figure 5. The increase of influenza B seen during the spring was also reflected in an increased positivity, reaching 10–11 percent in weeks 6–12, 2023.
Figure 3. Total number of laboratory-confirmed cases of influenza (all types) per week and the dominating influenza type(s) per season, 2017–2018 to 2022–2023.
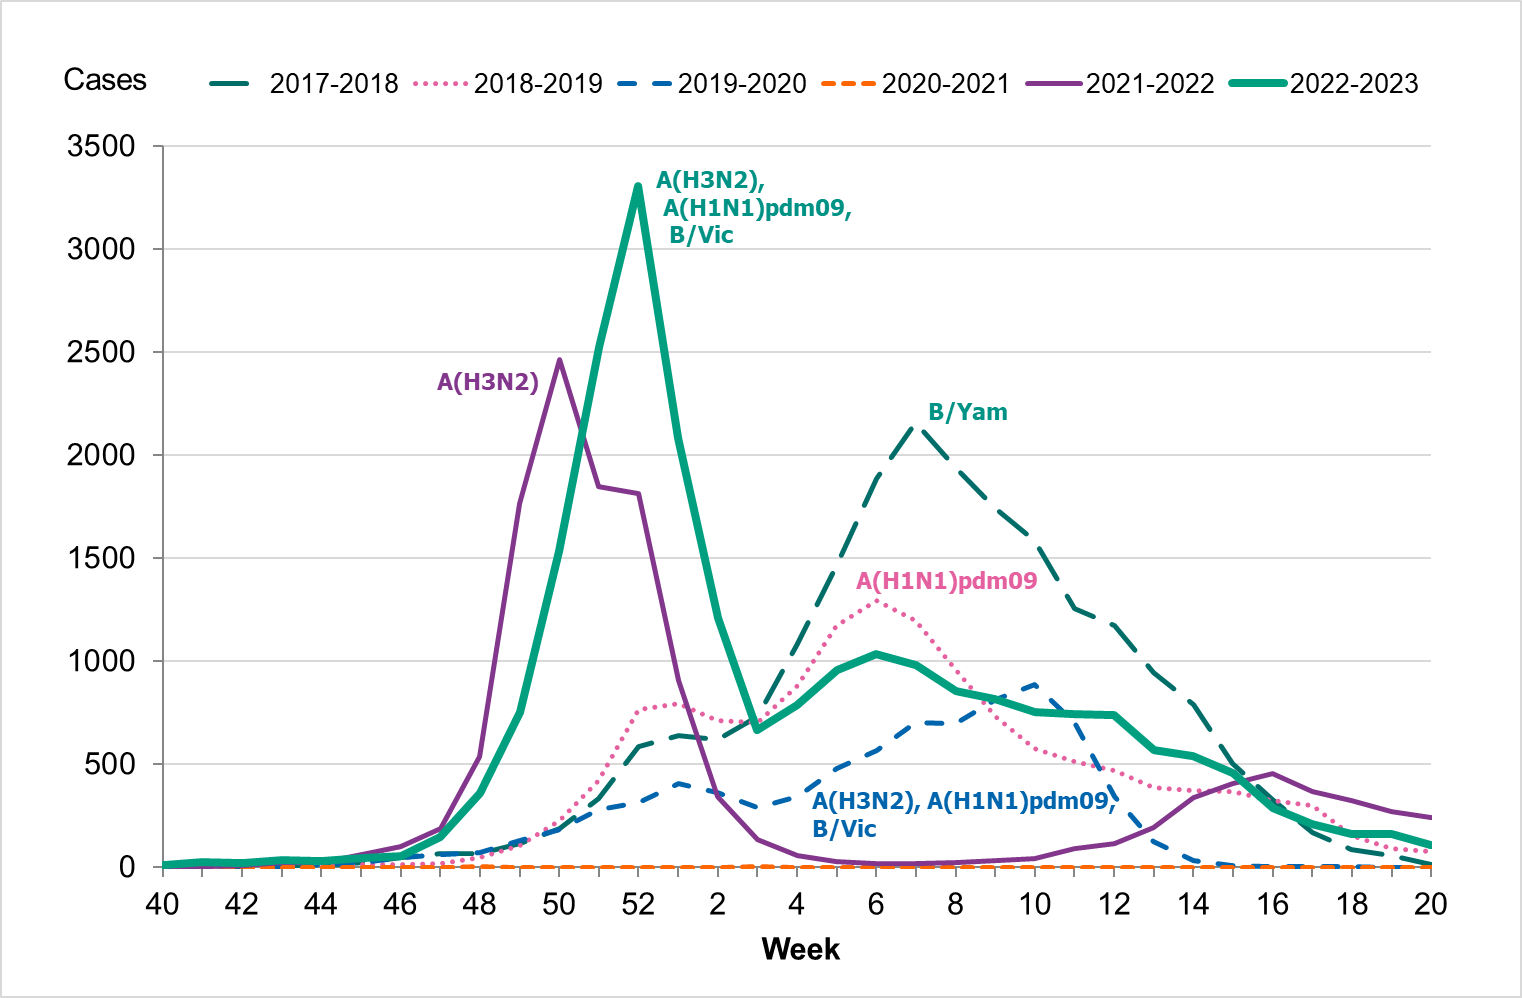
Figure 4. Total number of laboratory-confirmed cases of COVID-19, influenza (A and B), and RSV per week, 2022–2023.
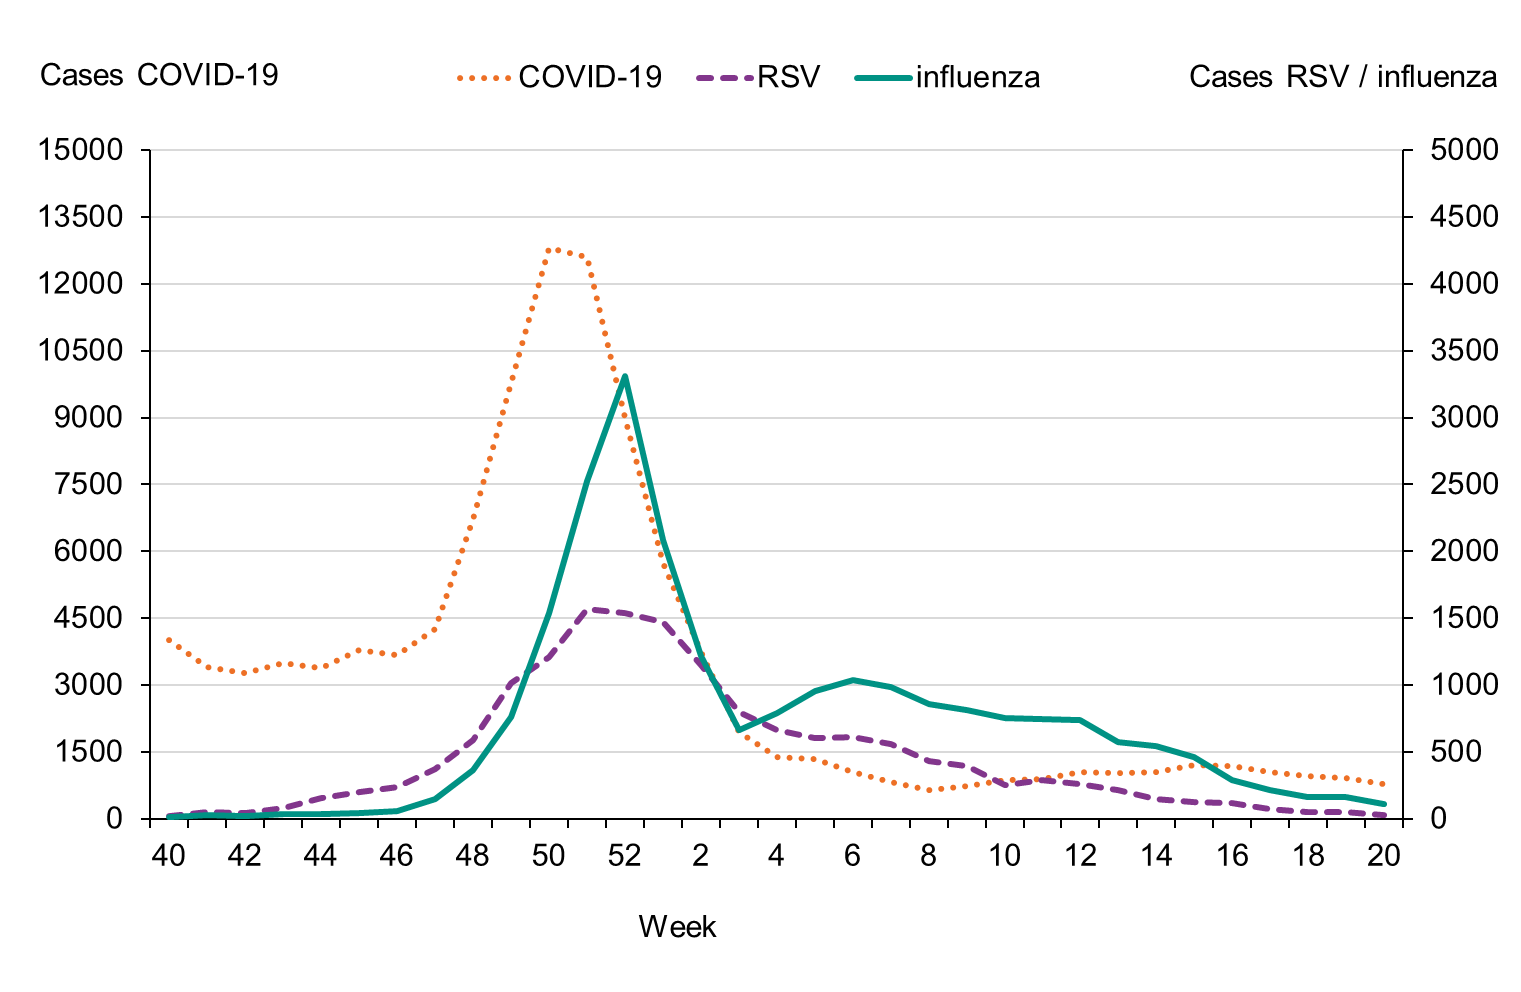
Figure 5. Percentage of samples testing positive for influenza, per week, 2017–2018 to 2022–2023.
Viral distribution
During the 2022–2023 season, 23,015 laboratory-confirmed cases were reported, of which the majority were influenza A (78 percent). Table 3 summarises the laboratory reporting results over the last six seasons, including the number of analysed samples and the proportion of positive samples as well as the total number of positive samples by type.
| Indicator | 2017–2018 | 2018–2019 | 2019–2020 | 2020–2021 | 2021–2022 | 2022–2023 |
|---|---|---|---|---|---|---|
| Analysed samples | 88,837 | 83,325 | 75,819 | 175,048 | 425,423 | 324,112 |
| Proportion positive samples (percent) | 23 | 17 | 11 | 0.02 | 3 | 7 |
| Total positive for influenza A | 7,406 | 13,664 | 5,441 | 10 | 13,150 | 17,848 |
| Total positive for influenza B | 13,280 | 93 | 2,500 | 19 | 137 | 5,167 |
Age and sex distribution
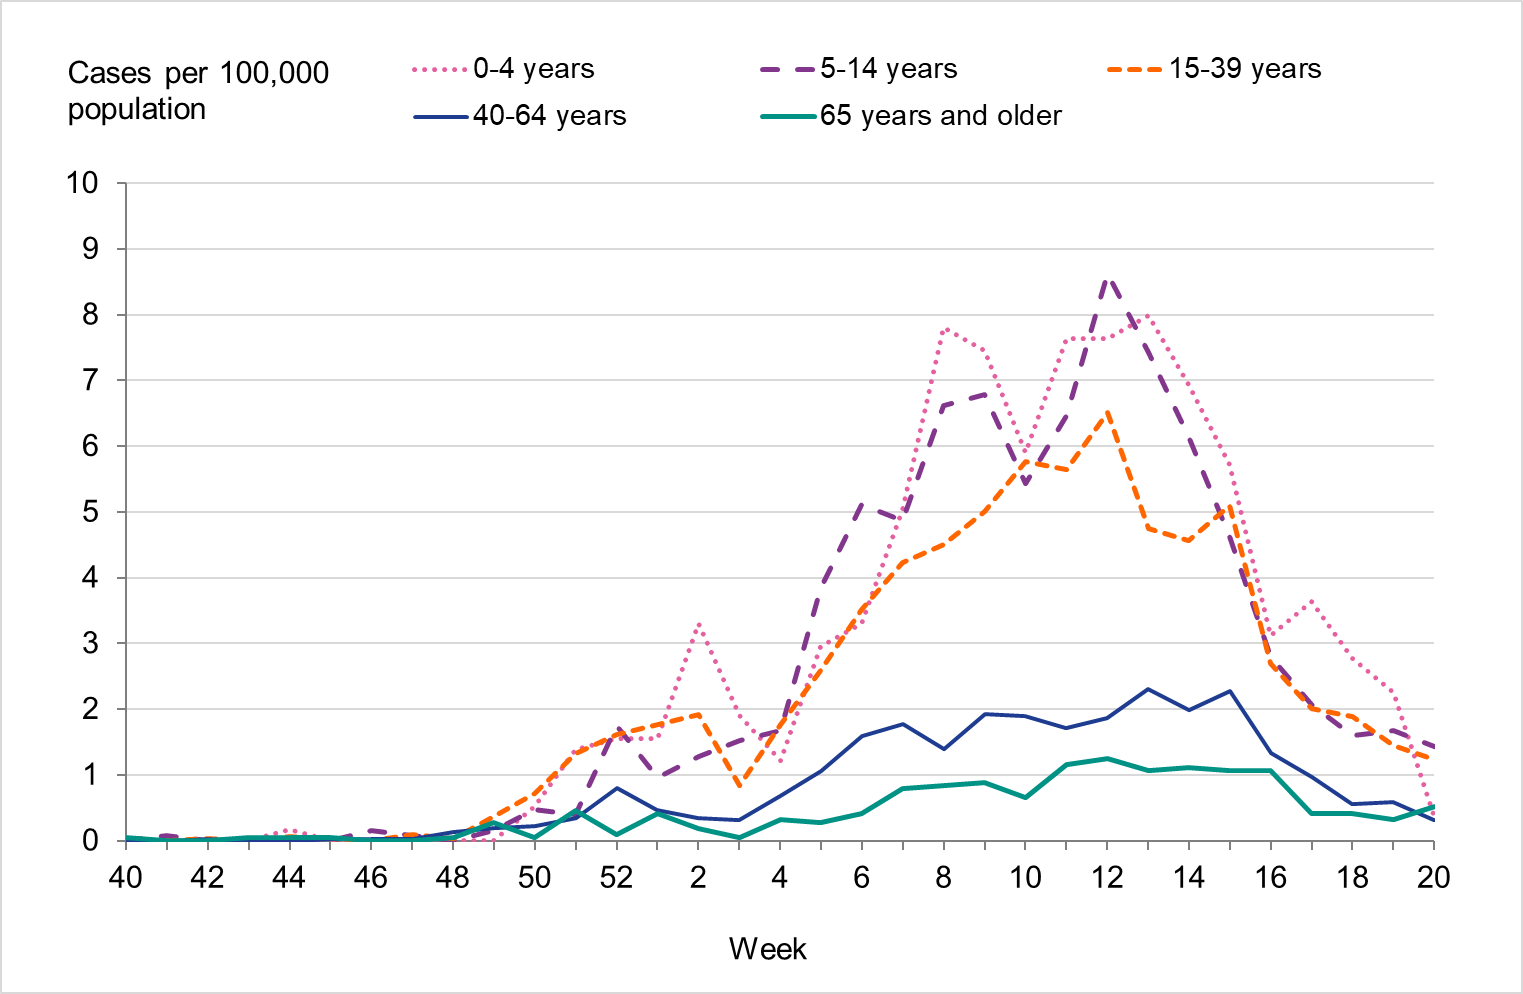
Overall, the highest weekly and cumulative notification rate (week 40, 2022 – week 20, 2023) of laboratory-confirmed influenza and of influenza A was seen among children aged 0–4 years old and persons aged 65 years and older, see Figures 6 and 7. These age groups are typically most affected by severe illness in an influenza epidemic. The highest weekly and cumulative notification rate of influenza B was seen among children aged 0–4 years old and children aged 5–14 years old, see Figure 8, while the lowest notification rate was seen among those 65 years and older. The median age for influenza A and B was 51 and 28 years, respectively, see Table 4. More women (55 percent) than men (45 percent) had laboratory-confirmed influenza.
Because of lower-than-usual spread of influenza during the COVID-19 pandemic, many younger children had not yet been exposed to influenza, meaning more were susceptible to infection. This age group saw high notification rates during both influenza A and B-dominant periods of the season. Data from telephone calls for medical advice regarding fever among children showed very high levels in the weeks leading up to this peak, when both COVID-19 and influenza were circulating widely (see the section Telephone advice line data). Overall, the cumulative notification rate of all influenza cases was higher among children aged 0–4 years than in previous seasons, likely due to a combination of increased testing and high levels of influenza transmission. The highest weekly notification rate was seen in week 52, when influenza A dominated the season, and it was higher than previous seasons, see Figure 9. The highest notification rate of influenza B was seen in weeks 8 and 11–13, and reached similar levels to the 2019–2020 season, which was when B/Victoria last circulated, see Figure 10, although the cumulative notification rate was higher in 2022–2023. Compared with the intense B/Yamagata season of 2017–2018, the cumulative notification rate was comparable, although the peak was lower.
Among persons 5–14 years and 15–39 years, the cumulative notification rate of influenza A was higher than seasons before the COVID-19 pandemic because testing of these groups has increased compared with those seasons, but peaks were lower than the 2021–2022 season when testing in society was even more widespread. Among those 40–64 years, the cumulative notification rate of influenza A was higher during the 2022–2023 season than all previous seasons, indicating higher transmission despite lower testing. For those aged 5–14 years and 15–39 years, the cumulative notification rate of influenza B was higher in the 2022–2023 season compared with 2017–2018, while the notification rate was considerably lower among those aged 40–64 years.
During March 2023, several cases with severe complications associated with influenza B infection were reported among adolescents, leading to a national investigation (see Appendix 1, Investigation of severe complications of influenza B among adolescents).
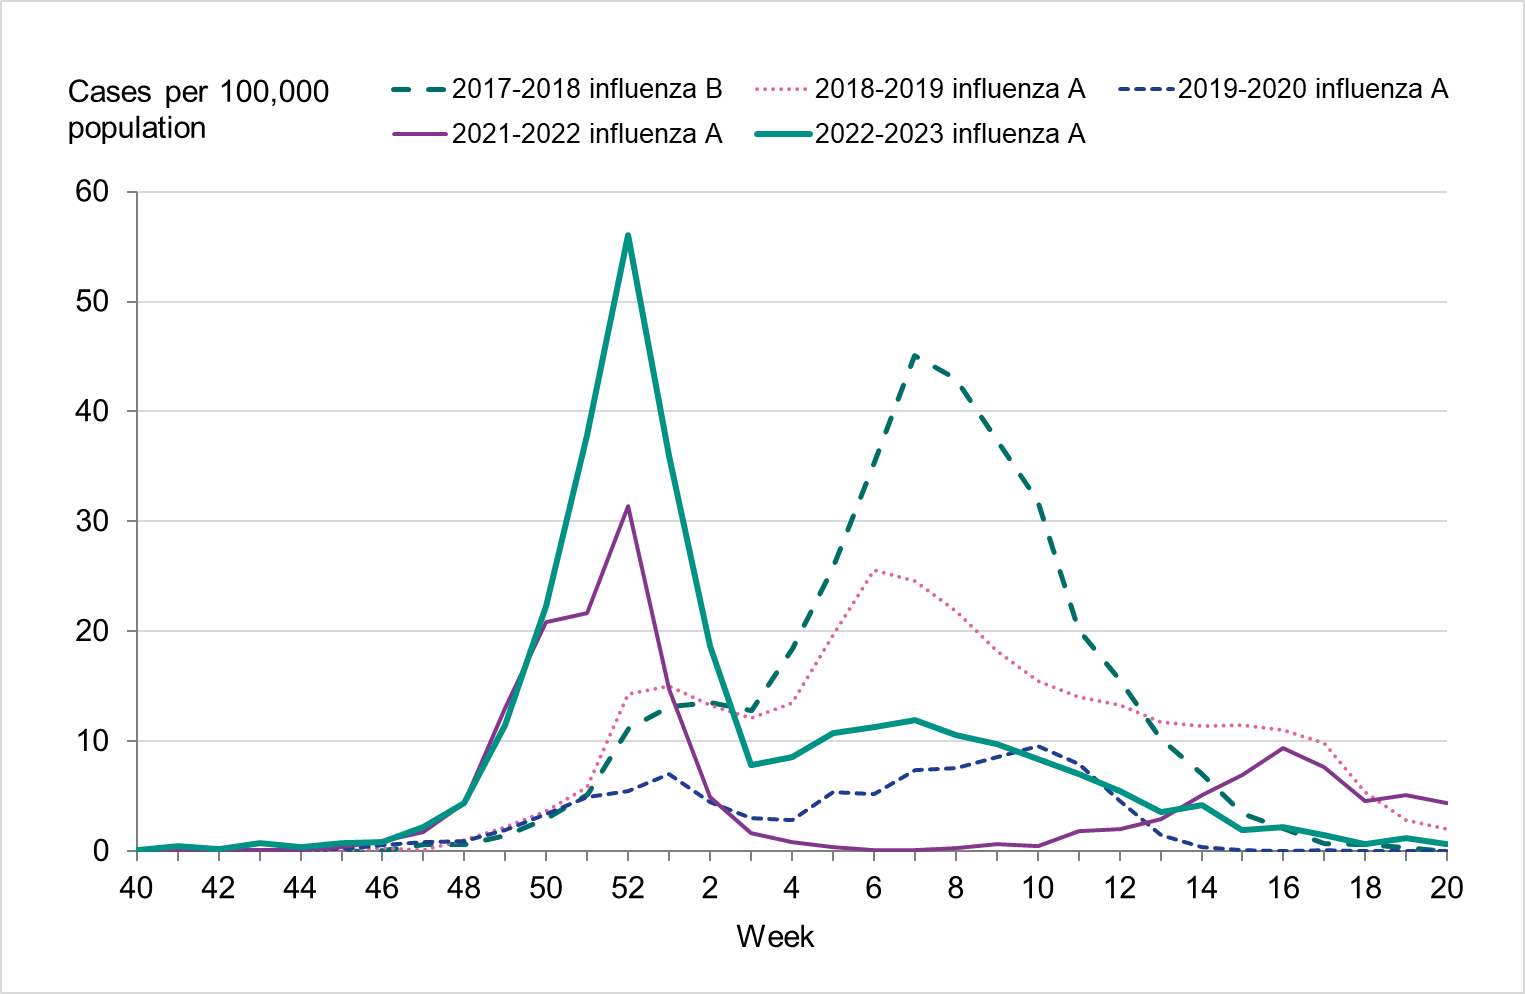
Among those 65 years and older, the cumulative notification rate was similar to the medium-intensity 2018–2019 season. However, the highest weekly number of cases of influenza A, in week 52, 2022, was similar to that of the intense peak in 2017–2018, during which B/Yamagata circulated, see Figure 11. Given increased testing it is likely that more milder cases were tested than in seasons before the COVID-19 pandemic. As noted, the cumulative notification rate of influenza B was low, which is likely explained by the fact that people 65 years and older have higher immunity towards influenza B/Victoria as compared with a B/Yamagata. Table 5 shows the number of cases per and notification rate per type and narrower age groups.
Season 2020–2021 is excluded from the figures below due to the small number of cases.
| Indicator | 2017–2018 | 2018–2019 | 2019–2020 | 2021–2022 | 2022–2023 |
|---|---|---|---|---|---|
| Median age influenza A | 70 | 60 | 51 | 35 | 51 |
| Median age influenza B | 68 | 37 | 24 | 39 | 28 |
| Dominant type | B/Yamagata | A(H1N1)pdm09 | mixed season | A(H3N2) | mixed season |
Figure 6. Cumulative notification rate (cases per 100,000 population) of laboratory-confirmed influenza cases per age group and season, Sweden, 2017–2018 to 2022–2023 seasons.
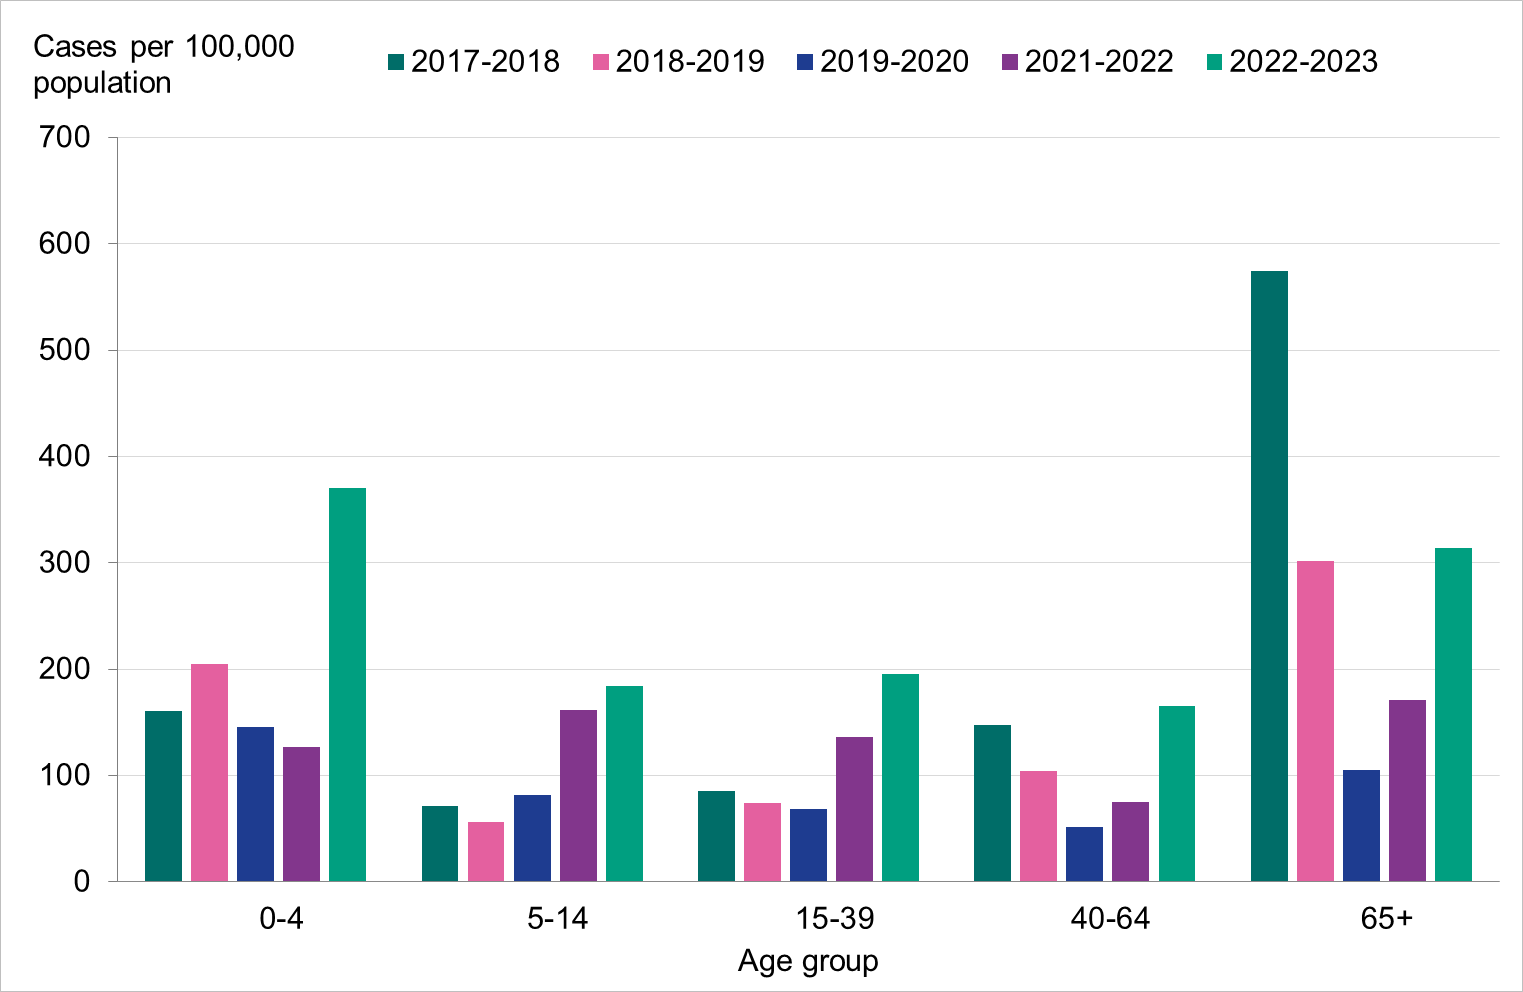
Figure 7. Weekly notification rate of influenza A per age group in Sweden, 2022–2023 season.
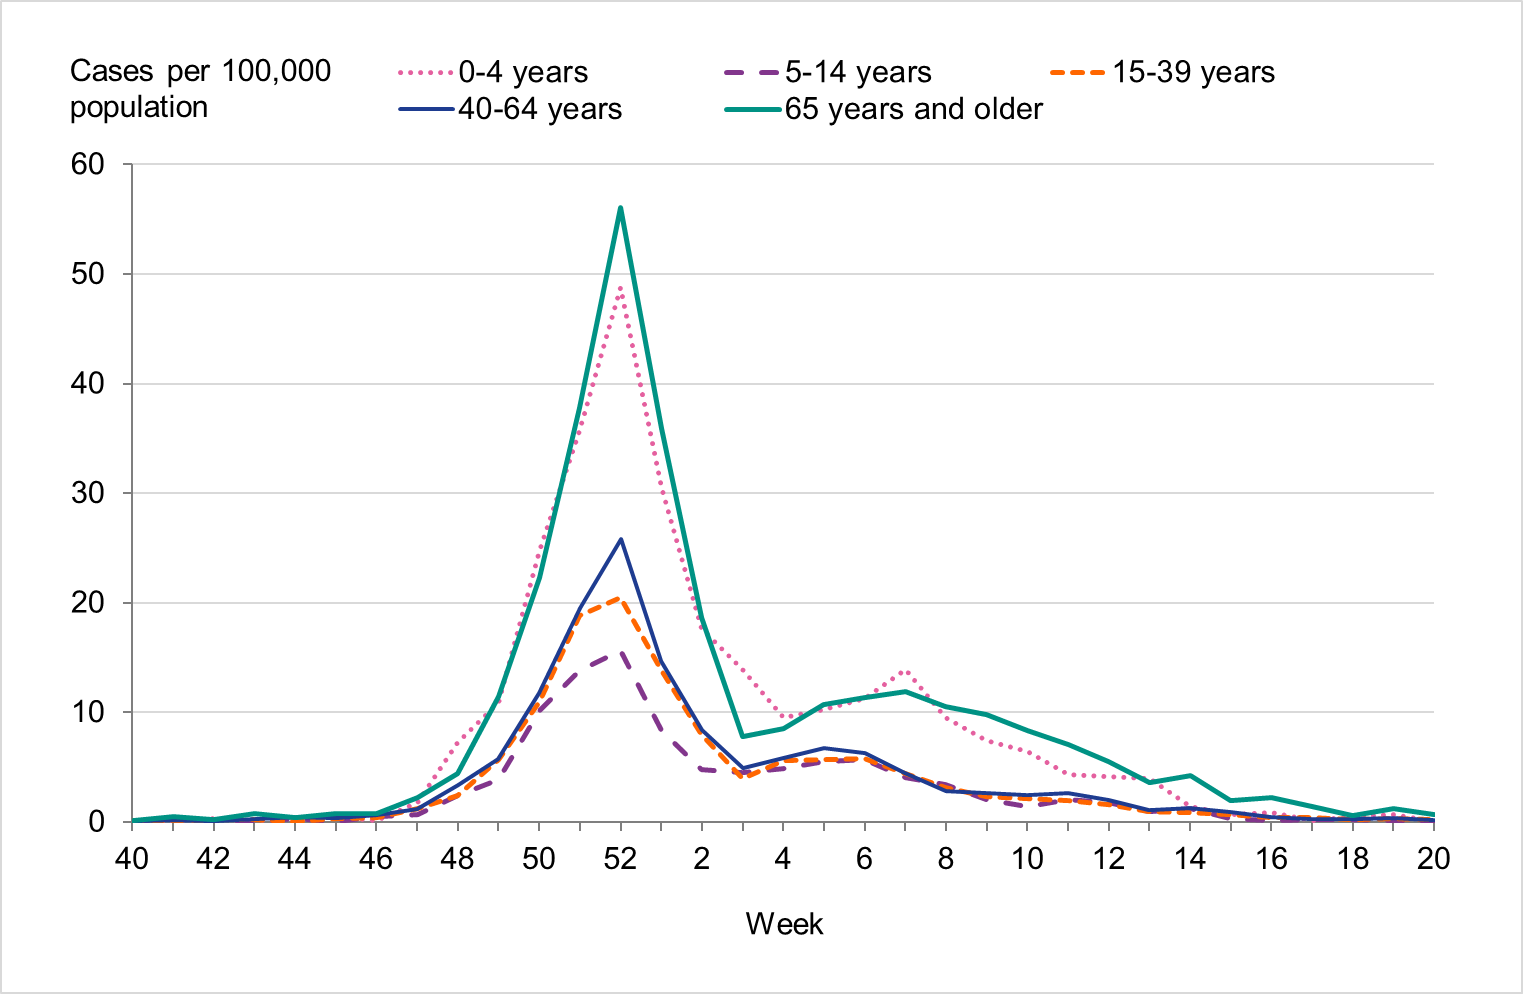
Figure 8. Weekly notification rate of influenza B per age group in Sweden, 2022–2023 season.
| Age group | Population (b) | Influenza A Cases | Influenza A per 100,000 | Influenza B Cases | Influenza B per 100,000 | Cases per 100,000 (all influenza) |
|---|---|---|---|---|---|---|
| 0–4 | 576 367 | 1603 | 278 | 531 | 92 | 370 |
| 5–14 | 1 252 726 | 1252 | 100 | 1053 | 84 | 184 |
| 15–39 | 3 330 305 | 4112 | 123 | 2399 | 72 | 196 |
| 40–64 | 3 215 021 | 4438 | 138 | 873 | 27 | 165 |
| 65–69 | 542740 | 850 | 157 | 62 | 11 | 168 |
| 70–74 | 524383 | 1053 | 201 | 37 | 7 | 208 |
| 75–79 | 497667 | 1454 | 292 | 51 | 10 | 302 |
| 80–84 | 308331 | 1277 | 414 | 38 | 12 | 426 |
| 85–89 | 171953 | 950 | 552 | 47 | 27 | 580 |
| 90–94 | 78387 | 620 | 791 | 54 | 69 | 860 |
| ≥95 | 23676 | 232 | 980 | 20 | 84 | 1064 |
| Total | 10 521 556 | 17 841 | 170 | 5165 | 49 | 219 |
(a) The table does not include sentinel cases or cases where age is unknown.
(b) Population on December 31, 2022. Source: Statistics Sweden, Statistikdatabasen.
Figure 9. Weekly notification rate of laboratory-confirmed influenza A among children aged 0-4 years in Sweden, 2017–2018 to 2022–2023.
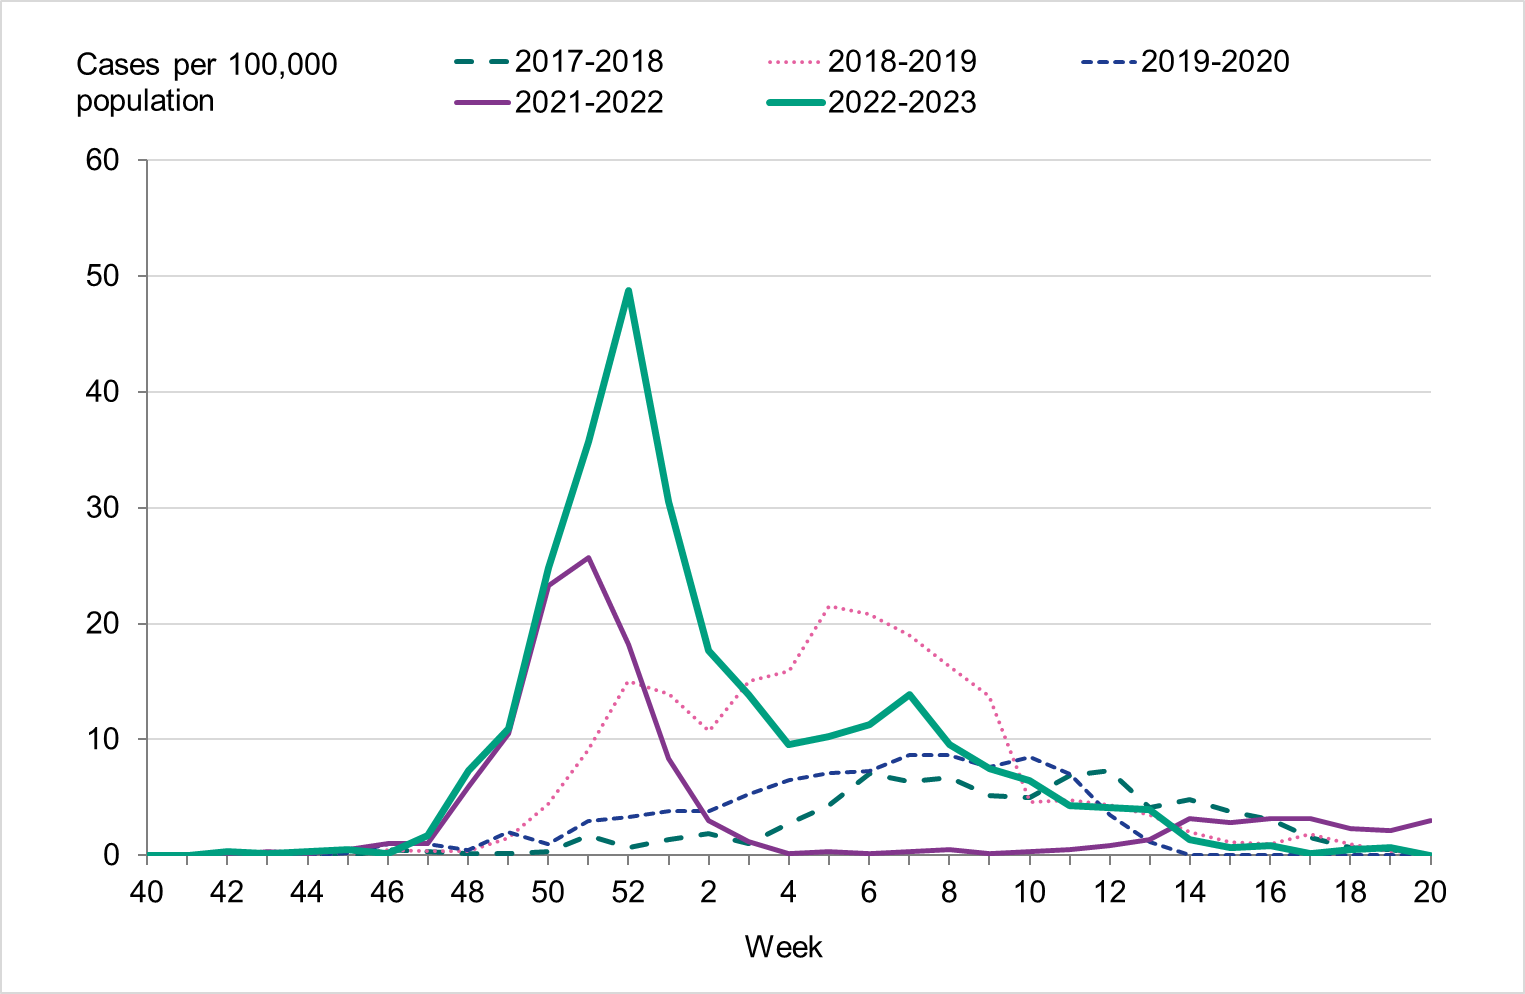
Figure 10. Weekly notification rate of laboratory-confirmed influenza B among children aged 0-4 years in Sweden, 2017–2018 to 2022–2023.
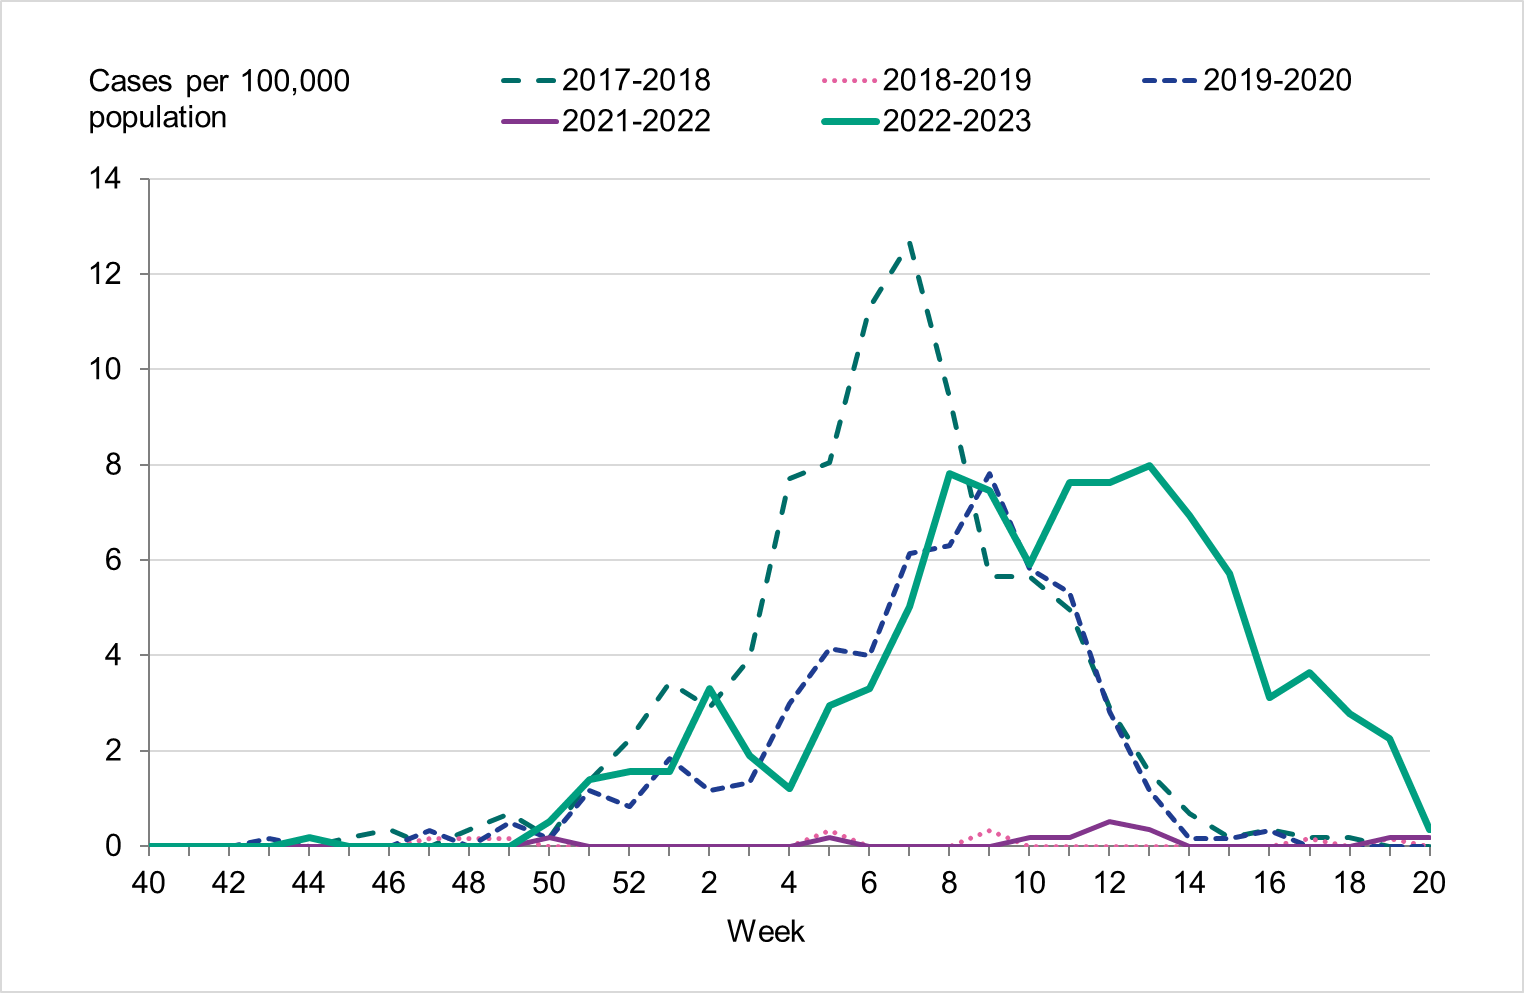
Figure 11. Weekly notification rate of laboratory-confirmed influenza (dominating type only, as shown in the legend) for individuals aged 65 and older in Sweden, 2017–2018 to 2022–2023.
Geographic distribution
There were marked geographical differences within Sweden in the spread of influenza during the season. From week 48, 2022, to week 2, 2023, the highest cumulative notification rate (per 100,000 population) of influenza A was seen in the northern parts of Sweden (Norrland), with a peak in week 52, 2022, see Figure 12. The peaks in the middle and southern parts of Sweden (Svealand and Götaland) occurred in the same week, but these were not as high as in Norrland. The percentage of samples positive for influenza had peaks in week 52 for all parts of Sweden. In the first weeks of January, cases of influenza A decreased in all parts of Sweden.
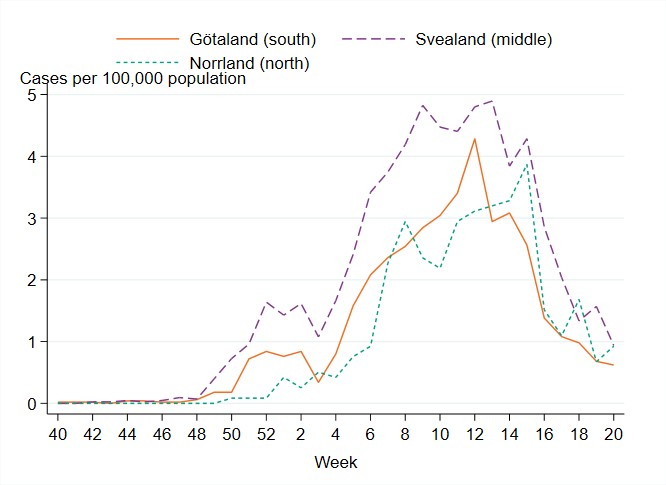
As cases of influenza A declined in January 2023, an increase of influenza B cases was seen in all parts of Sweden, with the highest notification rate in the middle parts of Sweden (Svealand), where cases peaked in week 13, 2023, see Figure 13. The notification rate reached its highest levels in week 12 in the southern parts of Sweden (Götaland) and week 15 in the northern parts (Norrland).
The geographical differences in the number of laboratory-confirmed cases might have been affected by healthcare-seeking behaviour as well as differences in sampling routines in the various regions.
Figure 12. Weekly notification rate of laboratory-confirmed influenza A per 100,000 population and region from week 40, 2022, to week 20, 2023.
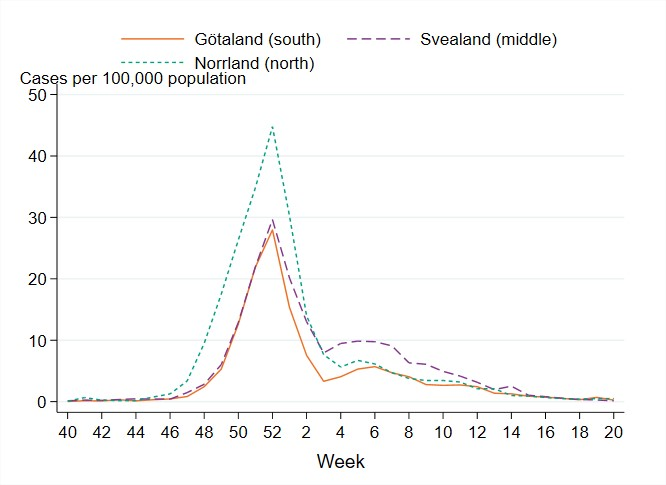
Figure 13. Weekly notification rate of laboratory-confirmed influenza B per 100,000 population and region from week 40, 2022, to week 20, 2023.
Antiviral sales
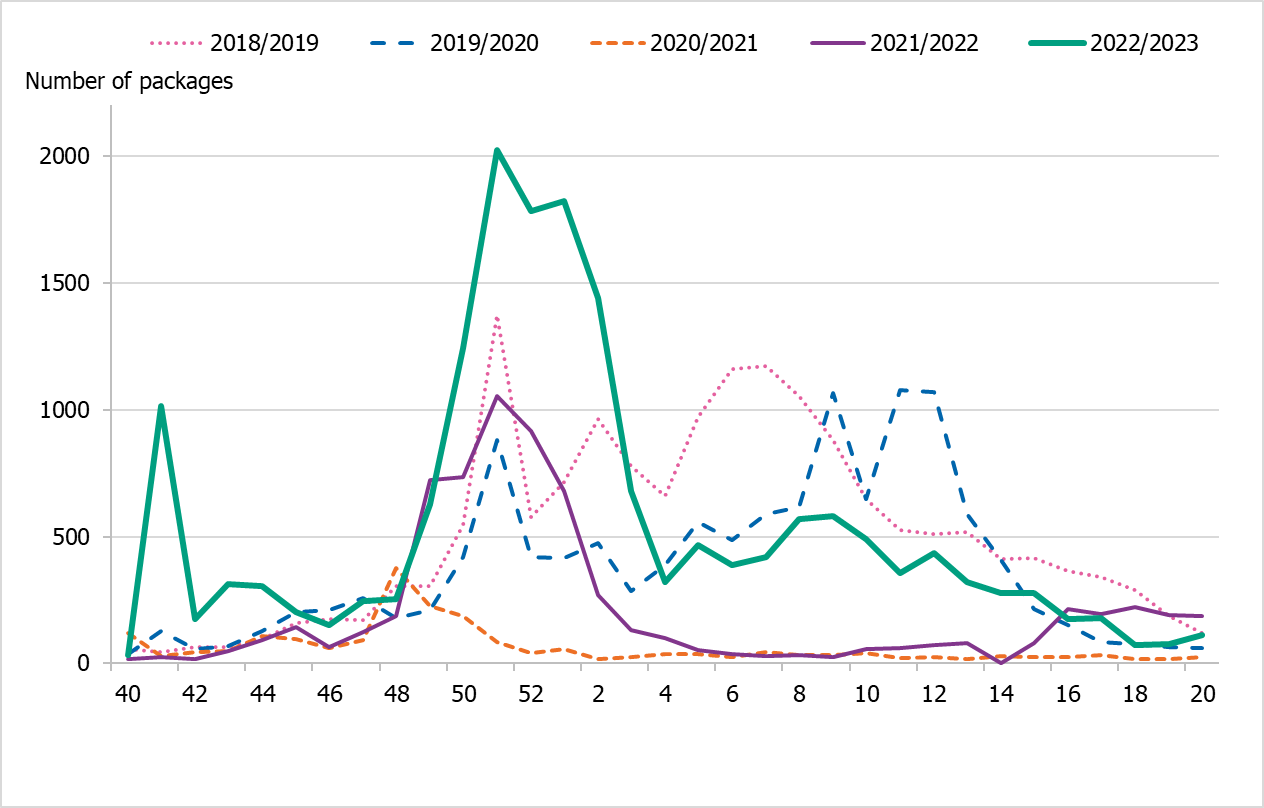
The PHAS receives weekly data from the Swedish eHealth Agency on the previous week's sales of the two most common antivirals used for influenza prophylaxis and treatment (zanamivir and oseltamivir). Data include dispensed prescription medications prescribed in outpatient care and healthcare requisitions (mainly medication used in inpatient care/hospitals). Data on prescriptions reflect patients receiving medical care for influenza-like symptoms, whereas requisitions are a combination of hospitals stocking up in preparation for intense periods as well as ongoing treatment of influenza patients. Sales are presented in terms of number of packages, with each package representing one patient course of treatment.
Cumulative sales of zanamivir and oseltamivir were at higher levels compared to the last season 2021–2022, but lower than during the last intensive influenza season of 2017–2018 (Table 6). Approximately 17,800 packages of antivirals were sold this season, compared with 7,000 packages for the same period in the 2021–2022 season. The season saw an increase in health care requisitions as a proportion of all sales, making up about 77 percent of the packages sold. In the previous five seasons, the corresponding figure has ranged between 58 and 69 percent. This may indicate an increased use of antivirals in in-patient care, as well as preparations for an intense season. The Swedish Medical Products Agency published updated recommendations regarding antiviral use for prophylaxis and treatment in June 2022 (5).
During the 2022–2023 season, sales increased steeply in the beginning of December (week 49) coinciding with an increase in notified influenza cases. This increase was seen in both requisitions and in prescriptions. After this period, sales roughly followed the pattern of influenza cases, decreasing through January but remaining elevated until the end of the season, see Figure 14. Sales of antivirals were lower than the number of influenza cases during the 2022–2023 season.
Figure 14. Total sales of the antivirals zanamivir and oseltamivir per week, all sales methods, five seasons.
| Indicator | 2017–2018 | 2018–2019 | 2019–2020 | 2020–2021 | 2021–2022 | 2022–2023 |
|---|---|---|---|---|---|---|
| Prescriptions | 7,120 | 6,086 | 5,263 | 774 | 2,154 | 4,197 |
| Health care requisitions | 12,790 | 10,534 | 7,252 | 1,370 | 4,869 | 13 642 |
| Total sales | 19,910 | 16,620 | 12,515 | 2,144 | 7,023 | 17 839 |
| Total influenza cases | 20,686 | 13,757 | 7,941 | 29 | 13,287 | 23,015 |
Influenza cases in intensive care
The PHAS receives data daily on influenza patients in intensive care through a collaboration with the Swedish Intensive Care Registry (SIR). A special reporting module in the registry, known as SIRI, allows reporting of patients at an intensive care unit with laboratory-confirmed influenza or COVID-19. The module includes individual factors on underlying medical conditions, complications, antiviral treatment, vaccination status, influenza type and subtype, and other data for patients undergoing treatment.
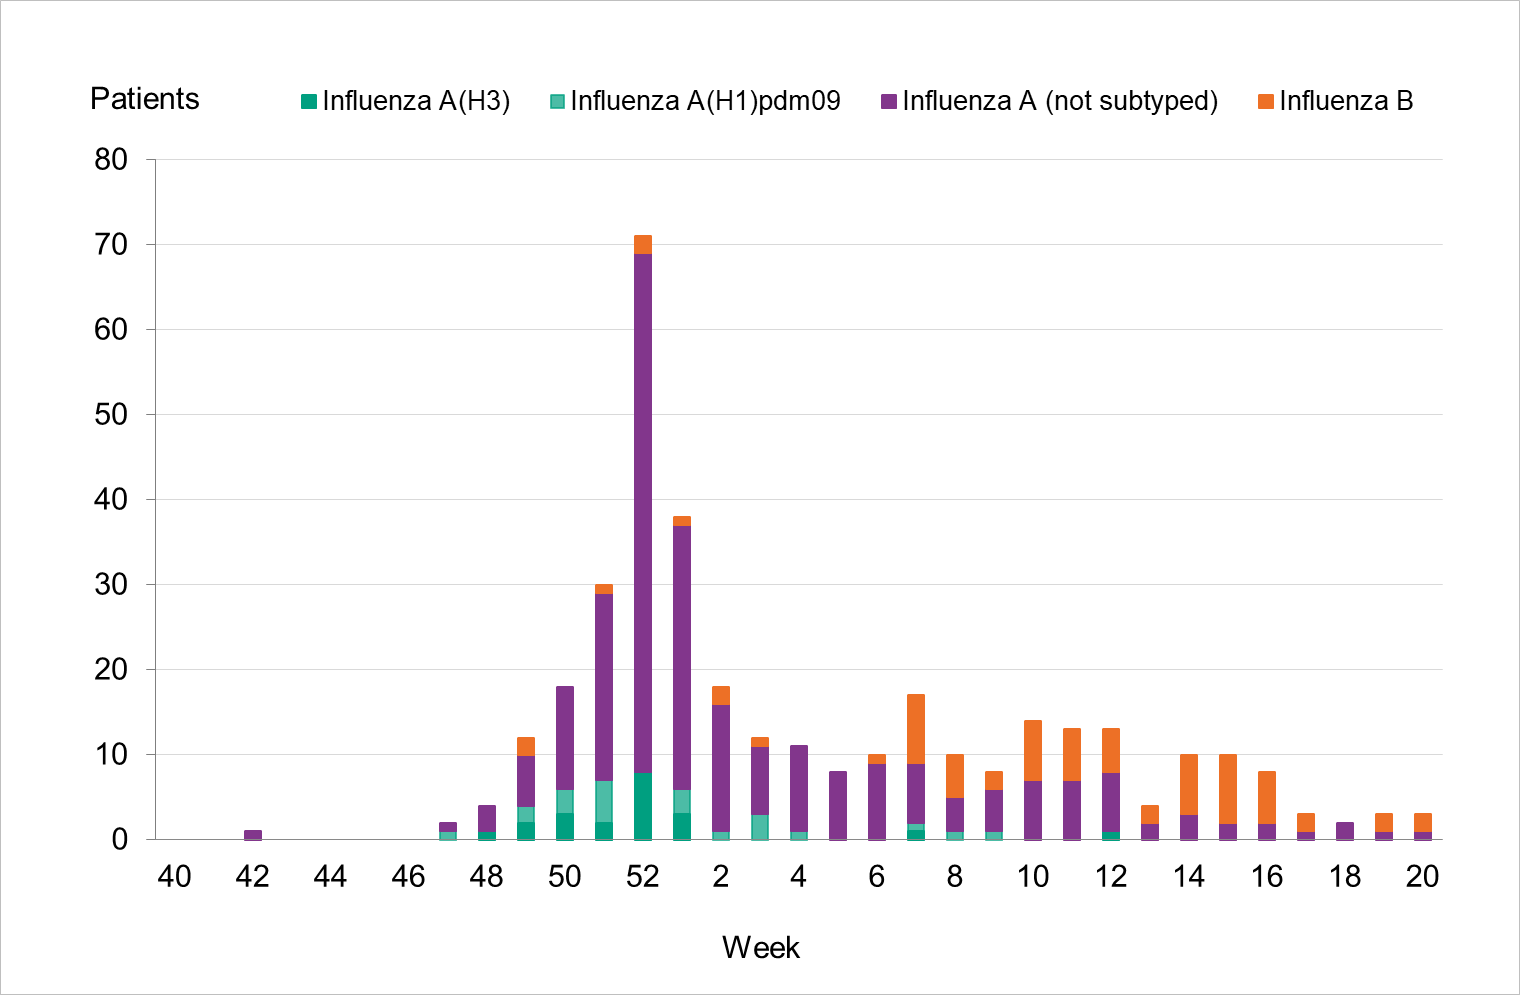
During the 2022–2023 season, 353 patients with influenza were reported as having received intensive care (Table 7), which is similar to the 2018–2019 season when both influenza A(H1N1)pdm09 and A(H3N2) circulated. Compared to the two previous seasons, the number of patients was higher. Of patients during the 2022–2023 season, 80 percent (281 patients) had influenza A and 20 percent (72 patients) had influenza B. Of 43 subtyped samples, 51 percent were influenza A(H1)pdm09 and the remainder were influenza A(H3). The greatest number of patients were admitted to intensive care during the peak of laboratory-confirmed cases of influenza in week 52 (71 patients, see Figure 15). The majority of influenza A cases were admitted in the first part of the season, and the cases with influenza B were admitted from January onward.
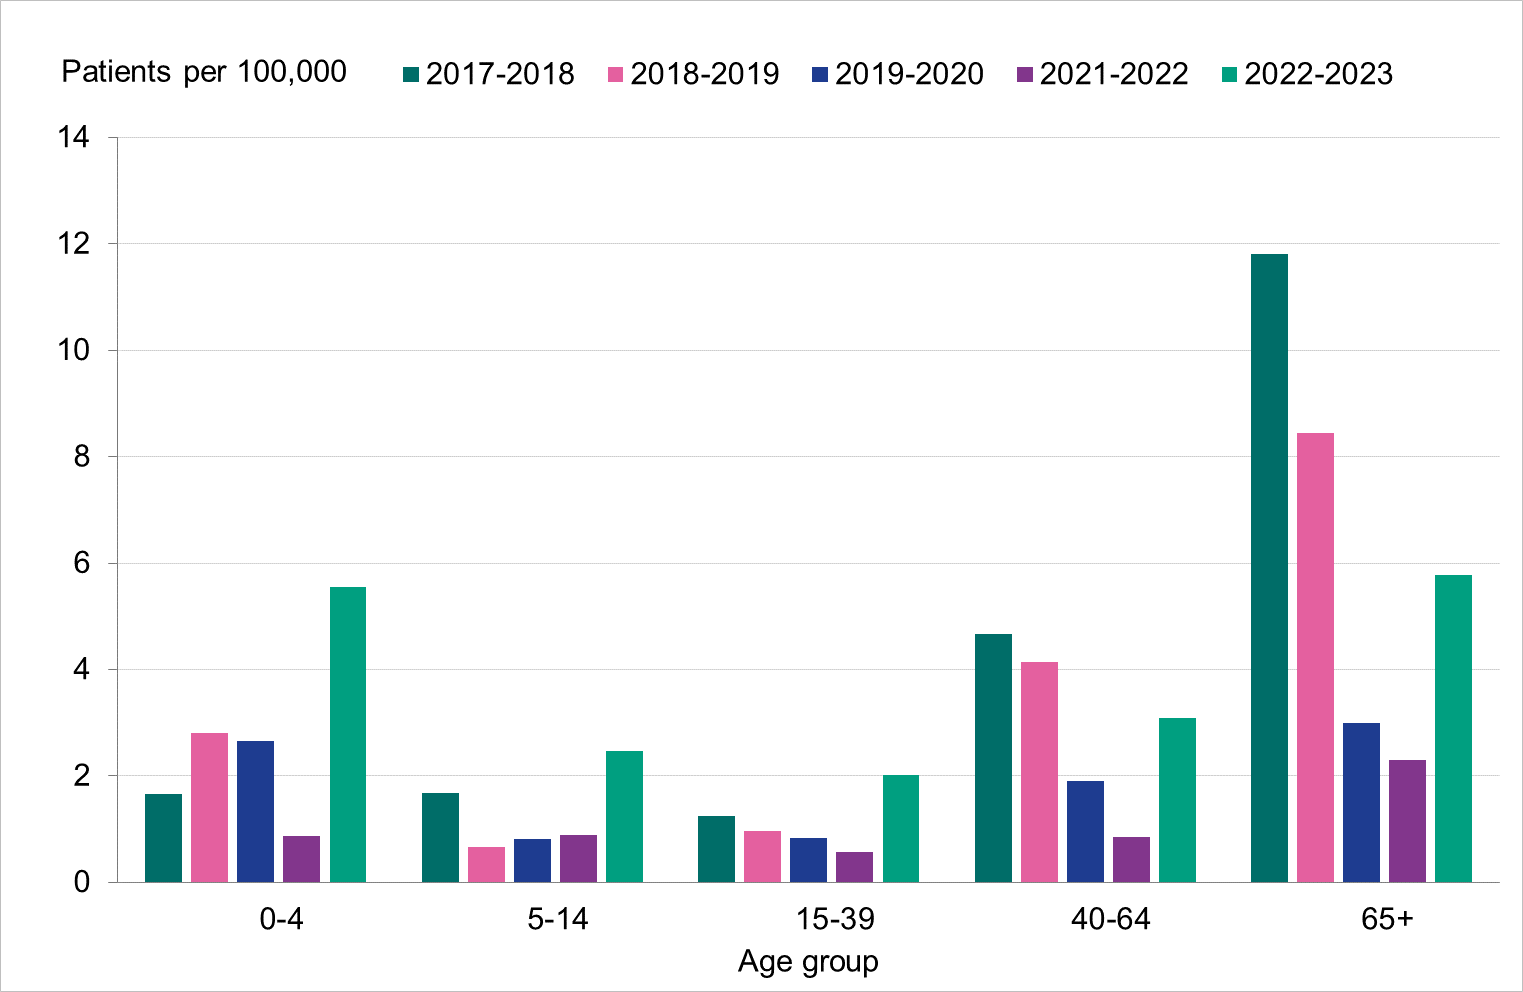
The highest incidence of intensive care per 100,000 population was seen among those 65 years or older and among children aged 0–4 years, see Figure 16 below, particularly due to influenza A. The age groups 0–4 years, 5–14 years and 15–39 years saw a substantially higher incidence of intensive care than the previous five seasons, while those aged 40–64 and 65 years and older were within the range of these seasons (Table 8). Nearly all patients 65 years or older who received intensive care had influenza A. The median age for patients with influenza A admitted to intensive care was 60 years, while it was 28 years for patients with influenza B (Table 9). In total, 54 percent of the patients were women and 46 percent were men. There were 71 patients under the age of 18 years.
Of all reported cases in intensive care with laboratory-confirmed influenza, 40 percent had influenza as the primary diagnosis in intensive care, and another 55 percent had influenza as a secondary diagnosis, with just over half of these having a circulatory or pulmonary code as the primary diagnosis code. Approximately 2 percent did not have influenza as a primary or secondary diagnosis, and for 3 percent the diagnosis codes were missing. The proportion of patients with primary diagnosis of influenza was 34 percent among those 65 years and older and 47 percent among those aged 0–4 years among all cases in intensive care with laboratory-confirmed influenza.
Of all reported cases in intensive care, 238 patients (67 percent) were in a risk group for severe influenza illness, either due to age (65 years and older) or due to having one or more medical risk factors. Chronic lung disease (26 percent), diabetes (20 percent) and chronic heart disease (19 percent) were the most commonly reported medical risk factors among patients in intensive care during the season. Among patients 65 years and older, approximately 19 percent did not have a medical risk factor. Among patients under the age of 65 years, half (115 patients, 50 percent) did not have a medical risk factor. Three patients were pregnant, of which one had influenza A and two had influenza B.
Vaccination status was known for 95 patients who were in risk groups and therefore recommended vaccination. Of these, 27 patients (28 percent) were vaccinated this season and the majority (67 percent) of the vaccinated patients were aged 65 years or older. The proportion of vaccinated was higher among those aged 65 years and above (39 percent) compared to those aged under 65 years (18 percent). The median age for vaccinated patients was 73 years.
Of the patients requiring intensive care, seven were reported to have received extracorporeal membrane oxygenation (ECMO) treatment. However, this number is known to be subject to under-reporting.
Figure 15. Number of patients with influenza in intensive care by influenza type or subtype per week, 2022–2023 season.
| Type or subtype | 2017–2018 | 2018–2019 | 2019–2020 | 2021–2022 | 2022–2023 |
|---|---|---|---|---|---|
| Influenza A (not subtyped) | 139 | 316 | 109 | 94 | 238 |
| Influenza A(H1N1)pdm09 | 9 | 35 | 24 | 0 | 22 |
| Influenza A(H3N2) | 13 | 6 | 8 | 16 | 21 |
| Influenza B | 291 | 2 | 34 | 0 | 72 |
| Total | 452 | 359 | 175 | 110 | 353 |
(a) Season 2020–2021 is not included because only one case (influenza B) was reported during the season.
| Age group | Influenza A | Influenza B | Total patients | Patients per 100,000 population | Percentage of total (%) |
|---|---|---|---|---|---|
| 0–4 years | 24 | 8 | 32 | 6 | 9 |
| 5–14 years | 19 | 12 | 31 | 2 | 9 |
| 15–39 years | 30 | 37 | 67 | 2 | 19 |
| 40–64 years | 87 | 12 | 99 | 3 | 28 |
| 65 years and older | 121 | 3 | 124 | 6 | 35 |
| Total | 281 | 72 | 353 | 3 |
| Indicator | 2017–2018 | 2018–2019 | 2019–2020 | 2021–2022 | 2022–2023 |
|---|---|---|---|---|---|
| Median age influenza A | 64 | 64 | 61 | 61 | 60 |
| Median age influenza B | 67 | - | 15 | - | 28 |
Season 2020–2021 is not included due to the small number of cases.
Median age not shown when cases are fewer than 5.
Figure 16. Cumulative incidence (per 100,000 population) of intensive care of patients with laboratory-confirmed influenza per age group and season, Sweden, 2017–2018 to 2022–2023 seasons. Season 2020–2021 is not included due to the small number of cases.
Incidence of patients in intensive care with influenza
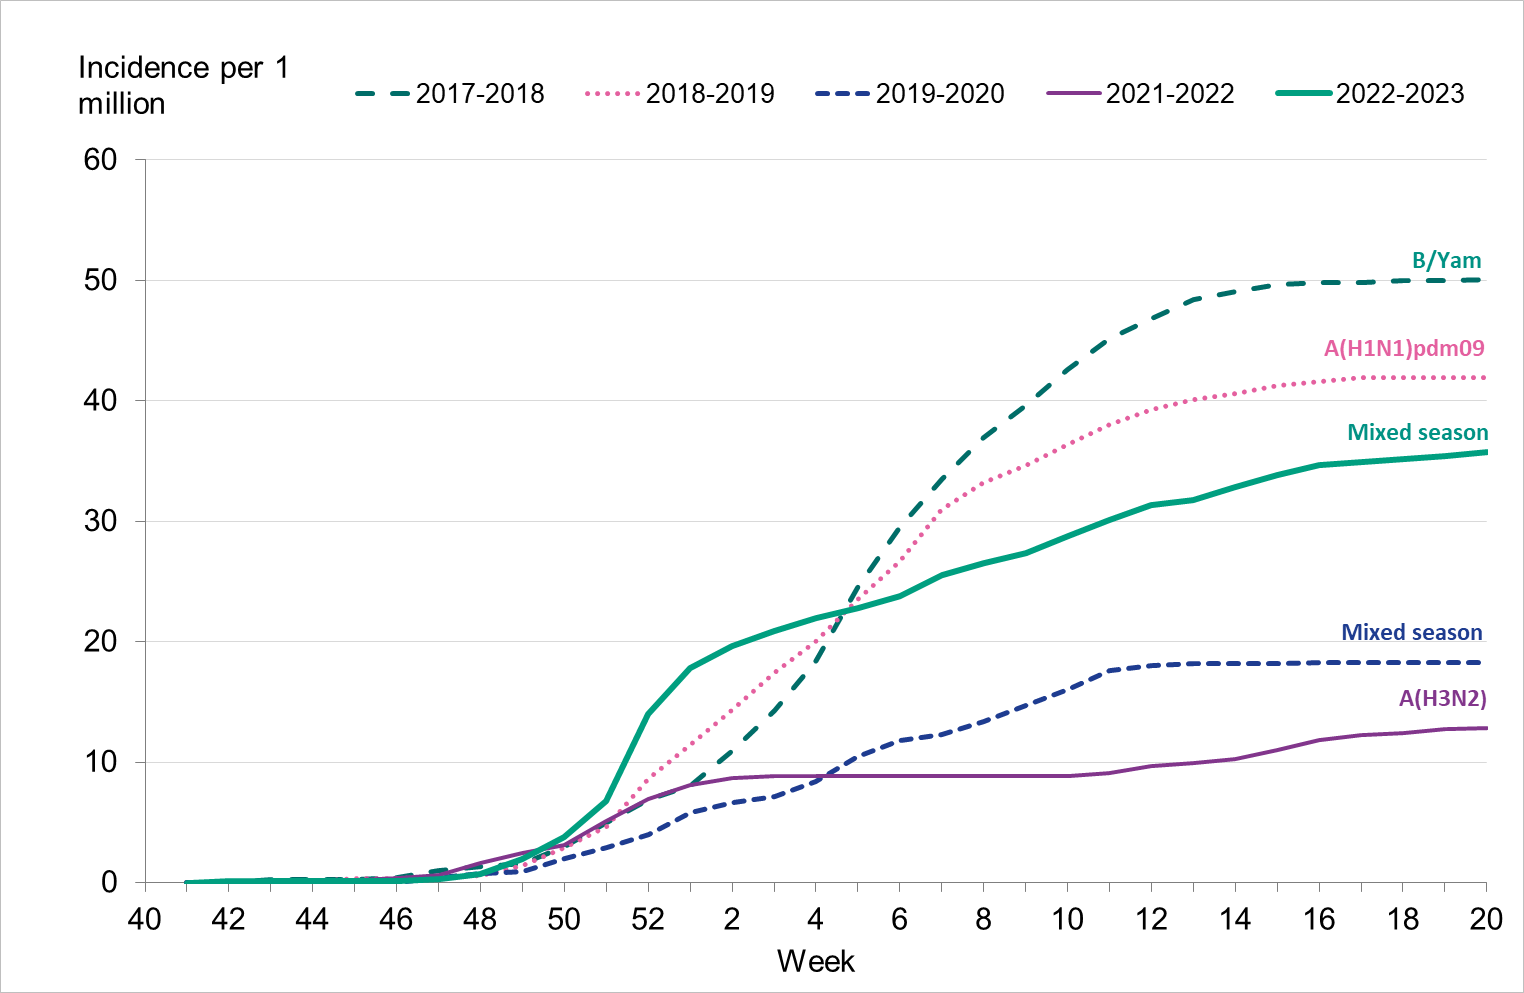
To enable comparison with the past seasons, we estimated the weekly incidence of patients in intensive care with influenza based on preliminary estimates of regional catchment population denominators. The highest peak in week 52, 2022, was higher than that of the previous five seasons (Figure 17). However, the cumulative incidence over the entire season was lower than the 2017–2018 and 2018–2019 seasons (Figure 18).
Figure 17. Weekly incidence of patients with influenza in intensive care in the last five seasons, 2017–2023. Season 2020–2021 not included due to low numbers.
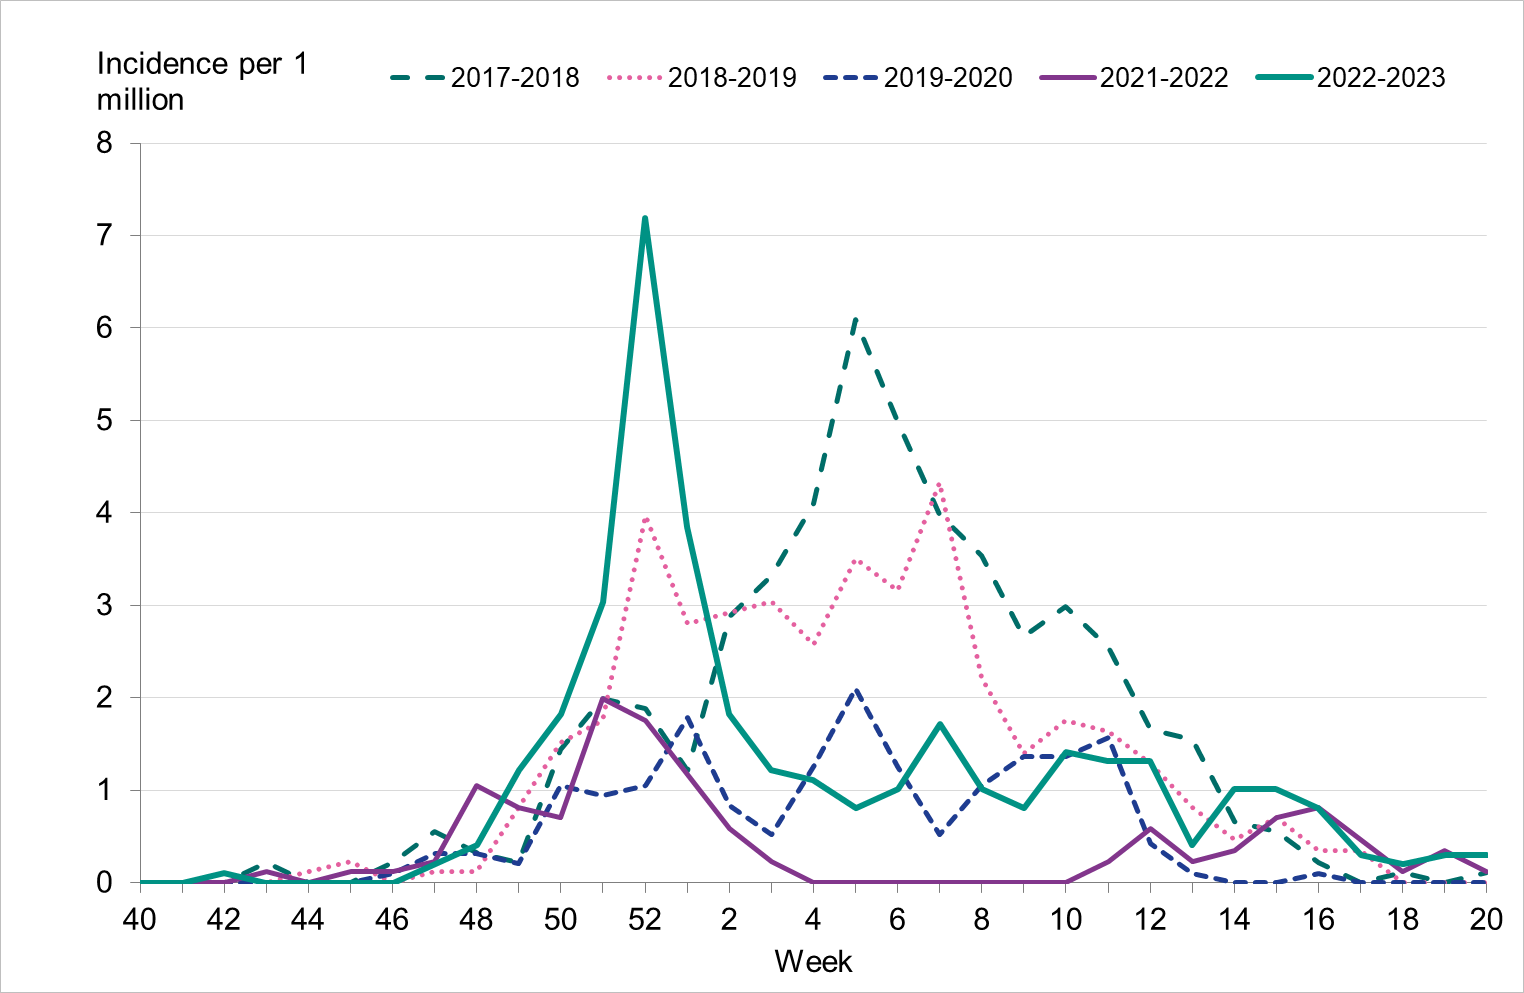
Figure 18. Cumulative incidence of patients with influenza in intensive care per week over the last five seasons, 2017–2023. Dominant type indicated above each seasonal line. Season 2020–2021 not included due to low numbers.
Influenza-related mortality
Influenza-related mortality is often noted during influenza seasons and varies with circulating strains and the intensity of the season. The PHAS uses different systems to measure influenza-related mortality: deaths within 30 days of influenza diagnosis, and excess crude (all cause) mortality.
Data on laboratory-confirmed influenza patients are intermittently linked to Swedish Tax Agency data on death in order to identify deceased individuals and to retrieve their dates of death. If 30 days or fewer have elapsed since the influenza diagnosis, the death is considered to be influenza related. One disadvantage of this method is that, because the cause of death is not considered, some deaths might be due to other causes than influenza, especially in older populations where overall mortality is high. Moreover, the measurement only includes deaths where influenza diagnosis was laboratory confirmed. Therefore, there are most likely a large number of unrecorded deaths from influenza. In addition, the data do not include information about underlying risk factors or complications of influenza infection. The analysis below includes data on cases reported until June 28, 2023 (Sunday week 25). Status after 30 days could not be ascertained for 301 cases that were missing a national identification number.
In order to identify crude (all cause) excess mortality during the influenza season, data on deceased individuals is transferred from the Swedish Tax Agency each week and analysed by the PHAS as part of the European monitoring of excess mortality for public health action (EuroMoMo) collaboration. The EuroMoMo model estimates the crude excess mortality for the whole country by age group and regionally, compared to baseline expected levels. Excess mortality during the winter may be related to influenza and other respiratory infections or to periods of extremely cold temperatures.
Deaths within 30 days of influenza diagnosis
In total, 603 of 23,082 persons who received a laboratory-confirmed influenza diagnosis during the 2022–2023 season died within 30 days of diagnosis. This corresponds to 2.6 percent of the laboratory-confirmed cases, which is slightly lower compared to the four seasons before the COVID pandemic for which this analysis has been possible (range 2.7–4.9 percent, see Table 10). The majority of these deaths (77 percent) occurred within 15 days of diagnosis.
Patients who died within 30 days of diagnosis had a median age of 83 years, whereas patients who survived at least 30 days after diagnosis had a median age of 40 years. This reflects the high burden of severe influenza illness among the elderly. The median age for patients who died with influenza A and B was similar at 83 and 84 years, respectively. In total, 8 percent of all people aged 65 and older who had laboratory-verified influenza died within 30 days, which is within the range of previous seasons (7–9 percent). Most of those who died (90 percent) were aged 65 years and older.
Of deaths occurring within 30 days of diagnosis, the majority had an influenza A diagnosis (563 people, 93 percent). This corresponds to 3 percent of influenza A cases. Among influenza B cases, 40 deaths were reported, see Figure 19, corresponding to less than 1 percent of cases. None of those who died were reported with both influenza A and B. For most of those with influenza A who died within 30 days, subtype was not determined (89 percent, 501 patients), while 36 cases had influenza A(H3N2) and 26 cases had influenza A(H1N1)pdm09.
Of those who had not died within 30 days, 78 percent had influenza A, and 22 percent had influenza B, while less than 0.5 percent had both influenza A and B (54 cases). The median age of survivors was 49 years for influenza A and 28 years for influenza B.
Slightly more women than men died within 30 days of an influenza diagnosis (54 percent of the deaths were among women), but the difference was not statistically significant.
Figure 19. Deaths among laboratory-confirmed influenza cases per week of death, 2022–2023 season. The figure does not include a small number of deaths occurring after week 20.
| Influenza season and dominant type | Cases | Deaths | Deceased, all ages (percent) | Deceased, ages 65+ (percent) | Median age of deaths | Median age of survivors |
|---|---|---|---|---|---|---|
| 2017–2018, B/Yamagata | 20 438 | 1012 | 4.9 | 8 | 84 years | 67 years |
| 2018–2019, A(H1N1)pdm09 | 13 324 | 505 | 3,8 | 7 | 81 years | 59 years |
| 2019–2020, mixed season | 7 799 | 218 | 2.7 | 9 | 81 years | 36 years |
| 2020–2021, no season | 29 | 0 | (a) | |||
| 2021–2022, A(H3N2) | 13,749 | 296 | 2.2 | 7 | 84 years | 35 years |
| 2022–2023, mixed season | 23,082 | 603 | 2.6 | 8 | 83 years | 40 years |
(a) During the 2020–2021 season, none of the 29 reported cases had died within 30 days. Median age is not calculated due to low numbers.
In total, approximately 90 percent of deaths within 30 days occurred among people aged 65 years or older, while 7 percent of deaths occurred among adults aged 40–64 years and 3 percent occurred among people under the age of 40 years, see Table 11. The proportion of deaths within 30 days increased with increasing age and varied from 0.2 percent for persons aged under 40 years to 21 percent for people 95 years and older. The analyses were not adjusted for expected mortality per age group.
| Indicator | <40 years> | 40–64 years | 65–69 years | 70–74 years | 75–79 years | 80–84 years | 85–89 years | 90–94 years | ≥95 years | Total |
|---|---|---|---|---|---|---|---|---|---|---|
| Total Cases | 10,994 | 5,326 | 914 | 1,090 | 1,505 | 1,317 | 1,001 | 674 | 252 | 23,073 |
| Cases/100,000 | 213 | 166 | 168 | 208 | 302 | 427 | 582 | 860 | 1,064 | 219 |
| Total Deaths | 18 | 45 | 25 | 50 | 82 | 109 | 106 | 116 | 52 | 603 |
| Deaths/100,000 | 0,3 | 1 | 5 | 10 | 16 | 35 | 62 | 148 | 220 | 6 |
| Deaths among cases (percent) | 0.16 | 0.84 | 2.7 | 4.6 | 5.4 | 8.3 | 11 | 17 | 21 | 2.6 |
This analysis includes all laboratory-confirmed influenza cases from week 40, 2022, to week 20, 2023. It excludes 301 patients whose personal identification number was not included in the case report, meaning that their status at 30 days could not be ascertained. It also excludes 9 cases without known age.
Excess mortality
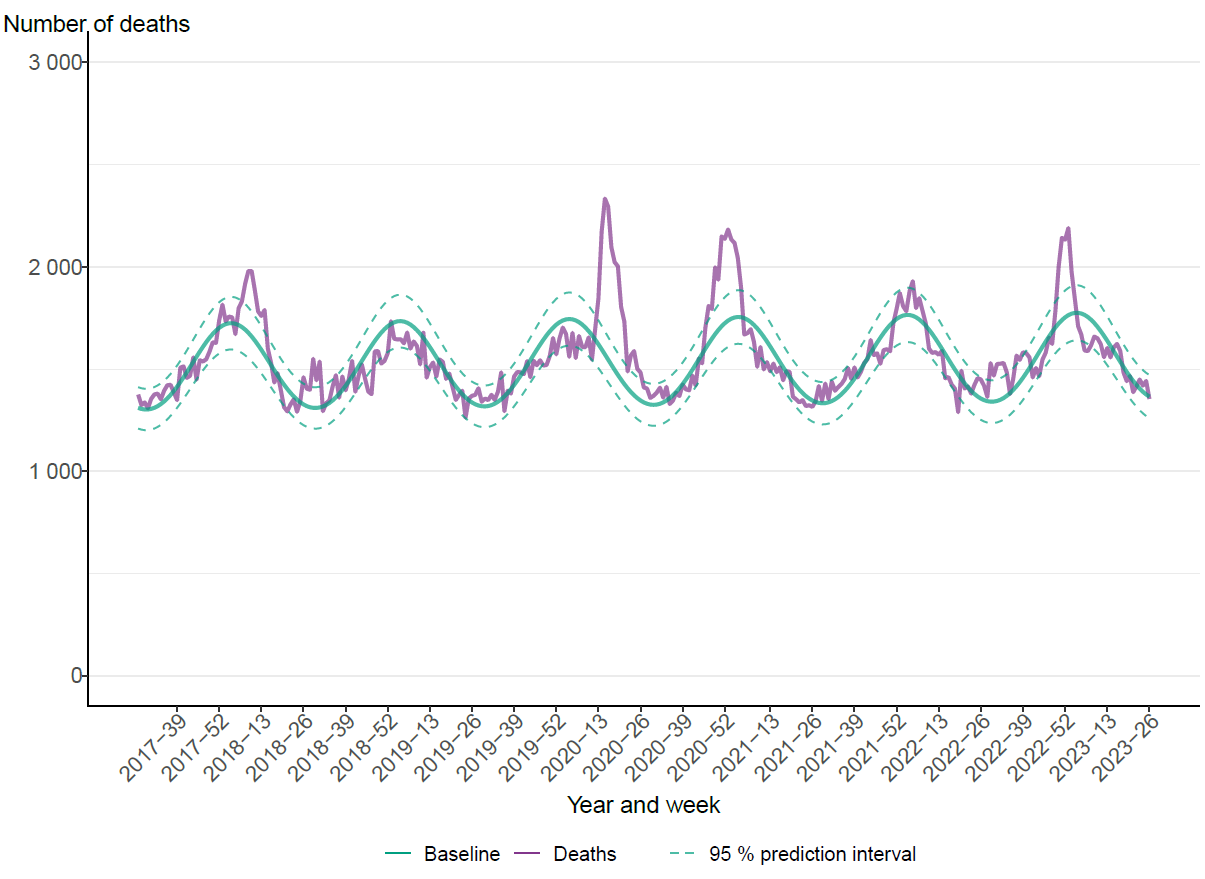
The PHAS monitors all cause excess mortality nationally and per age group and region through the EuroMOMO model. This model indicated significant excess mortality at the national level between week 50, 2022, and week 2, 2023, for the entire population, and particularly among those 65 years and older, see Figure 20. The extensive spread of influenza, COVID-19, and RSV is believed to have been the main cause of the excess mortality. Influenza-related mortality is more often seen in the age group 65 years and older because older people are at the greatest risk of dying from influenza. Similar trends were seen on the European level.
Figure 20. Number of crude and expected (baseline) deaths per week in the age group 65 years and older, Sweden, 2017 (week 27) to 2023 (week 26).
Sentinel sampling
A network of sentinel sampling sites for influenza surveillance was established in Sweden in 1999 and the active sentinel sampling sites during 2022–2023 were general practitioners (GPs). Virological analysis of samples from sentinel sites contributes to national and international surveillance of circulating influenza viruses. In order to estimate what proportion of the patients seeking care for influenza-like illness (ILI) or acute respiratory infection (ARI) actually has influenza, sites are encouraged to collect nasal samples from symptomatic patients. The samples are sent to the PHAS for initial PCR analysis of influenza and SARS-CoV-2 and samples with positive findings from PCR analysis are further analysed and the viral strains are characterized by sequencing. The PHAS carries out laboratory analyses free of charge for these samples. Patient characteristics, including age, sex, risk factors, syndrome (ILI vs. ARI), and vaccination status, are included in the analysis of the virological findings.
Data collected from the sentinel program in Sweden contributes to vaccine effectiveness studies for influenza and COVID-19 at the European level coordinated by the VEBIS network (Vaccine Effectiveness, Burden and Impact Studies). In the interim report for 2022–2023 in Europe, the vaccine effectiveness for all ages was estimated at or above 50 percent for influenza B and 27–44 percent for influenza A (6).
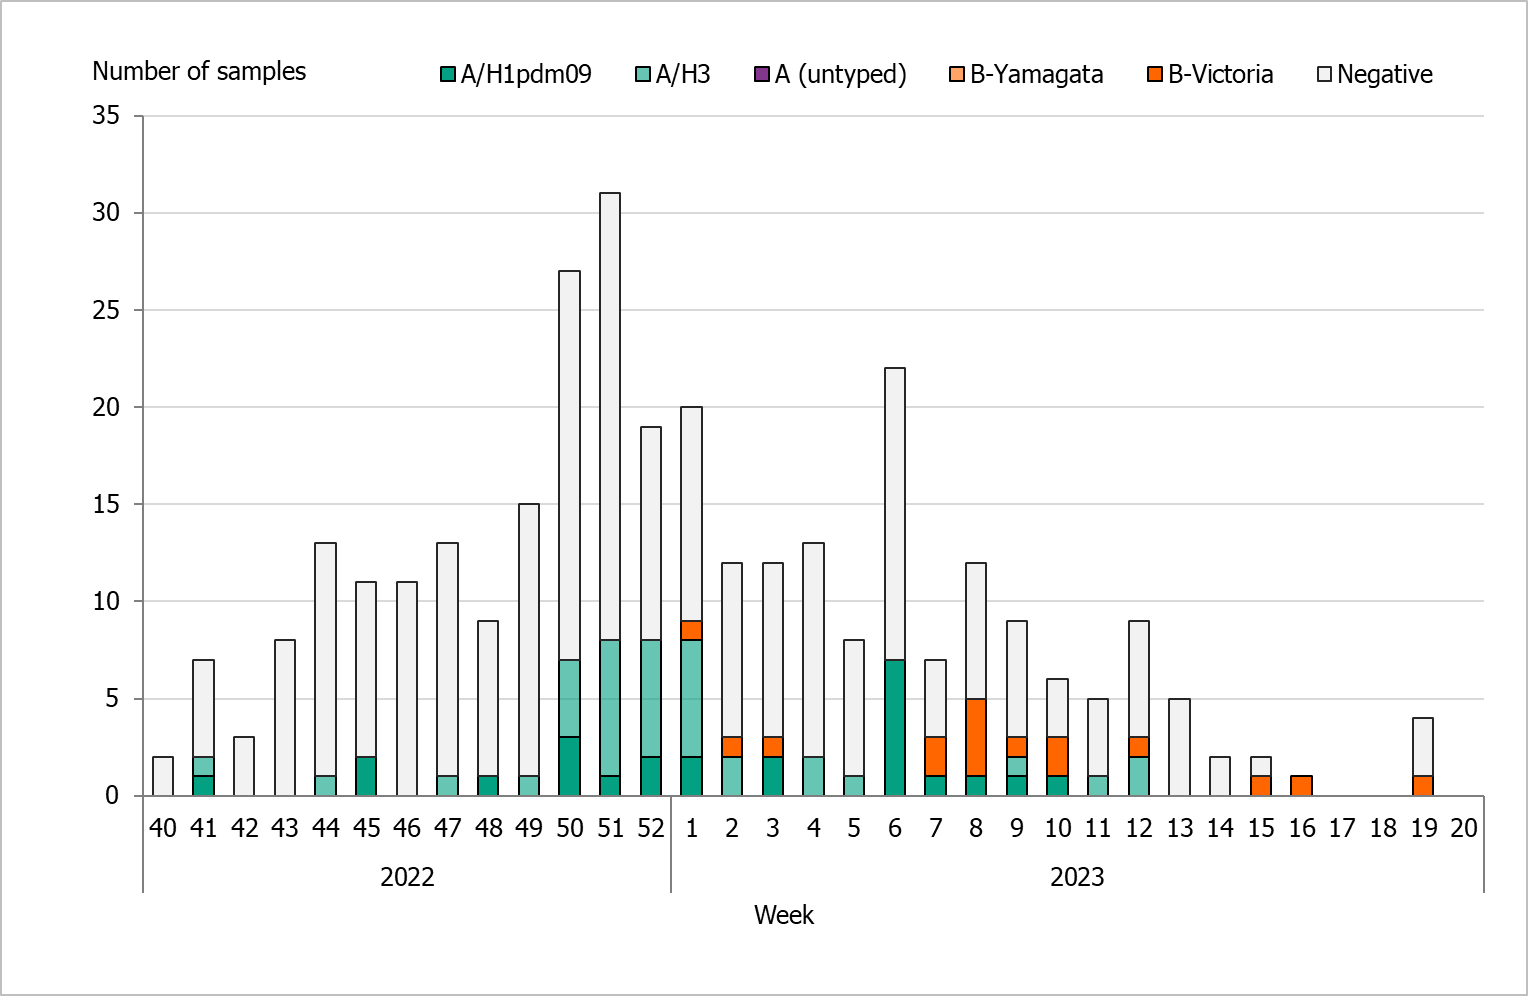
During the 2022–2023 season, 322 sentinel samples were submitted from 55 GP sites. In total, 77 samples (24 percent) tested positive for influenza. Figure 21 shows the distribution of samples taken and the positive samples by subtype/lineage. The first positive sentinel sample was taken in week 41, and the highest number of positive cases was seen in week 51. During the second epidemic wave in the spring (weeks 6–12), some positive cases were detected in sentinel surveillance. This pattern was seen in other surveillance systems. The sentinel monitoring of influenza for the season ended in week 20.
Of the subtyped or lineage-typed influenza-positive samples, 36 (47 percent) belonged to influenza A(H3), 25 (33 percent) belonged to A(H1)pdm09, and 16 (21 percent) belonged to B/Victoria. No cases of influenza B/Yamagata were found within the sentinel samples or laboratory-confirmed cases. Of the positive samples, three were co-infections of influenza A(H3) and SARS-CoV-2.
The activity of sentinel sampling sites during the 2022–2023 season was limited, and thus fewer data from sentinel sampling were collected compared to the pre-pandemic period. This could be due to changes in healthcare-seeking behaviour together with challenges and time constraints experienced by healthcare personnel in primary care. As part of the contining work on integrated influenza and SARS-CoV-2 surveillance, the goal is to strengthen the network to ensure the continuity and geographical representativeness of sentinel sites.
Figure 21. The weekly number of sentinel samples submitted and positive samples by subtype/lineage, 2022–2023.
Clinical features
Of the 322 patients sampled through the sentinel system with known symptoms, 81 percent had ILI and 17 percent had ARI. In total, 60 percent of the samples came from women. Thirty-six percent of the samples were collected from patients belonging to a risk group due to age and/or medical condition (n = 96). Of these, 67 percent were aged 65 years or older (n = 75). The most common reported medical risk factors were chronic lung disease (n = 24), chronic heart disease (n = 18), diabetes (n = 15), immunosuppression (n = 6), and pregnancy (n = 5). The tables below summarise the laboratory results from the sentinel sampling system for the last three epidemic seasons, including the number of samples (Table 12), median age, ILI percentage, and sub/lineage type (Table 13). Season 2020–2021 is excluded due to very low levels of influenza.
| Samples | 2019–2020 | 2021–2022 | 2022–2023 |
|---|---|---|---|
| Analysed | 2,102 | 376 | 322 |
| Negative | 1,718 | 324 | 247 |
| Positive | 384 | 52 | 77 |
| Proportion positive (percent) | 18 | 14 | 24 |
| Positive for influenza A | 218 | 52 | 61 |
| Positive for influenza B | 166 | - | 16 |
| Type or subtype | 2019–2020 number | 2019–2020 median age | 2019–2020 ILI (percent) | 2021–2022 number | 2021–2022 median age | 2021–2022 ILI (percent) | 2022–2023 number | 2022–2023 median age | 2022–2023 ILI (percent) |
|---|---|---|---|---|---|---|---|---|---|
| Analysed | 2,102 | 40 | 81 | 376 | 51 | 90 | 322 | 47 | 81 |
| A(H1N1)pdm09 | 125 | 35 | 92 | 0 | - | - | 25 | 34 | 100 |
| A(H3N2) | 87 | 22 | 88 | 42 | 25 | 100 | 36 | 38 | 78 |
| A, not subtyped | 6 | 32 | 83 | 10 | 51 | 90 | - | - | - |
| B/Victoria | 166 | 14 | 89 | - | - | - | 16 | 33 | 100 |
| B/Yamagata | - | - | - | - | - | - | - | - | - |
(a) Median age is not shown for single cases.
Influenza infection among vaccinated patients
Vaccination status was reported for 289 (90 percent) of the 322 patients sampled during the season. Of these, 60 (19 percent) were vaccinated. Among the patients belonging to a risk group (96), 46 percent were vaccinated. Influenza was detected among nine vaccinated patients, of which eight were positive for influenza A and one was positive for B/Victoria. Subtyping showed five cases of influenza A(H3) and three cases of influenza A(H1)pdm09.
Virus characterisation
Subtyping and lineage determination
All diagnostic laboratories perform influenza typing using molecular assays for influenza A and B, and some perform subtyping of influenza A. The PHAS performs subtyping and lineage typing by real-time PCR for all samples sent in from the diagnostic laboratories and on all positive samples from sentinel surveillance.
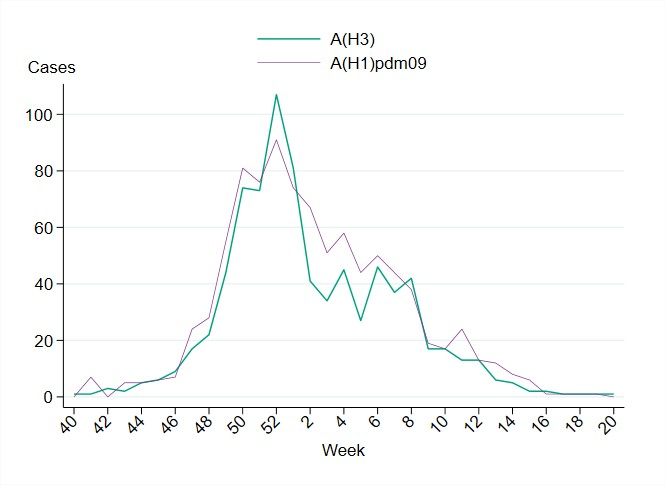
In total, 1,710 influenza A-positive samples from laboratories in Sweden were subtyped during the season, of which 914 (53 percent) were A(H1)pdm09 and 796 (47 percent) were A(H3). As shown in Figure 22, the subtyped cases of both types of influenza A displayed a very similar pattern. The lineage was determined for 471 influenza B-positive samples, and all belonged to the B/Victoria lineage and none to the B/Yamagata lineage. The subtype and lineage of influenza-positive samples from sentinel and laboratory reporting systems are presented in Table 14.
In the sentinel sampling system, a higher proportion of influenza A(H1N1)pdm09 than influenza A(H3N2) was detected, as is usual during mixed seasons such as 2022–2023. In the sentinel system, patients are sampled by their GPs and generally have milder disease.
| Influenza type | 2017–2018, Sent. (percent) | 2017–2018, Lab (percent) | 2018–2019, Sent. (percent) | 2018–2019, Lab (percent) | 2019–2020, Sent. (percent) | 2019–2020, Lab (percent) | 2021–2022, Sent. (percent) | 2021–2022, Lab (percent) | 2022–2023, Sent. (percent) | 2022–2023, Lab (percent) |
|---|---|---|---|---|---|---|---|---|---|---|
| A(H1N1)pdm09 | 6 | 13 | 76 | 63 | 33 | 25 | 0 | 1 | 33 | 42 |
| A(H3N2) | 17 | 23 | 23 | 37 | 23 | 44 | 100 | 98 | 47 | 36 |
| B/Victoria | <1> | <1> | 1 | <1> | 44 | 31 | 0 | 1 | 21 | 22 |
| B/Yamagata | 77 | 64 | <1> | <1> | 0 | 0 | 0 | 0 | 0 | 0 |
Figure 22. The number of subtyped influenza A cases in the laboratory reporting system per week, 2022–2023. Please note that the figure does not include unsubtyped influenza A cases, which made up the majority of influenza A cases during the season.
Genotypic and phenotypic characterisation
A selection of the influenza-positive samples from laboratories and from the sentinel surveillance programme are genetically characterised through whole genome sequencing (NGS on an Ion Torrent platform), and viruses isolated on cell culture undergo phenotypic sensitivity to neuraminidase (NA) inhibitors using a MUNANA-based NA inhibition assay. Samples are selected to be as representative as possible in terms of geographical location, period of collection, and type/subtype/lineage type. The Swedish laboratories are also asked to send influenza-positive samples to the PHAS from severely ill or deceased patients, patients with vaccine break-through infections, and patients who do not respond to antiviral treatment. These samples all undergo further characterisation if the viral load is high enough. Genetic characterisation and virus isolation is usually successful for samples with a real-time PCR Ct-value ≤30 or below.
The hemagglutinin (HA) gene is further analysed and affiliated to genetic groups in accordance with ECDC influenza characterisation guidelines. In addition, the parts of the HA gene that are the target for the subtype/lineage-specific real-time PCR systems used at the PHAS are analysed for sequence mismatches compared to primers and probes used in these systems. The NA gene is analysed with respect to amino acid substitutions previously shown to be associated with reduced or highly reduced inhibition by the NA inhibitors oseltamivir (Tamiflu®/Ebilfumin®), and zanamivir (Relenza®). The PA gene is analysed with respect to amino acid substitutions previously shown to be associated with a >3-fold increase in IC50-value for baloxavir marboxil (Xofluza®). The matrix gene of influenza A viruses is analysed with respect to amino acid substitutions previously shown to result in resistance to amantadine. The parts of the matrix gene sequences of influenza A and B that are targets in the real-time PCR systems that are used for detection of influenza at the PHAS are analysed for mismatches to the PCR primers and probes.
Phenotypic analysis of susceptibility to the NA inhibitors oseltamivir and zanamivir is performed with the neuraminidase inhibition (NAI) assay on a selection of the cell-propagated virus with the aim to cover all NA-sequence variants.
A representative selection of the isolated virus samples is sent to the WHOCC in London for antigenic characterisation and for phenotypic analysis of susceptibility to NA inhibitors with the NAI assay.
Characterisation data are continuously reported to the ECDC via TESSy, and sequence data are continuously uploaded to the Global Initiative on Sharing All Influenza Data (GISAID).
Genetic groups
The genetic groups of the 285 characterised Swedish influenza A and B viruses from the 2022–2023 season are shown in Tables 15A through C by influenza subtype or lineage and in the phylogenetic trees in Appendices 1–3. Of the characterised viruses, 89 were subtype A(H3N2), 101 were subtype A(H1N1)pdm09, and 95 were lineage type B/Victoria.
| Genetic group | Number of viruses (Percentage of viruses) | Comment |
|---|---|---|
| 3C.2a1b.2a.1 | 0 (0 percent) | |
| 3C.2a1b.1a | 0 (0 percent) | |
| 3C.2a1b.2a.2(A/Bangladesh/4005/2020)(A/Darwin/9/2021)(A/Slovenia/8720/2022) | 89 (100 percent) | Dominant genetic group among viruses reported within the European surveillance until week 20, 2023 (8).Genetic group affiliation of the recommended vaccine virus for the northern hemisphere seasons 2022–2023 and 2023-2024 (7, 9). |
| Genetic group | Number of viruses (Percentage of viruses) | Comment |
|---|---|---|
| 6B.1A.5a.1 | 0 (0 percent) | |
| 6B.1A.5a.2 (A/Victoria/2570/2019) |
0 (0 percent) | Genetic group affiliation of the recommended vaccine virus for the northern hemisphere, season 2022–2023 (7). Recommended vaccine viruses for the northern hemisphere for 2023–2024 are attributed to genetic subgroup 6B.1A.5a.2a.1 (9). |
| 6B.1A.5a.2 (A//Sydney/5/2021) | 87 (86 percent) | Dominant (51 percent) genetic group among viruses reported within the European surveillance until week 20, 2023 (8). |
| 6B.1A.5a.2(A/Norway/25089/2022) | 14 (14 percent) |
| Genetic group | Number of viruses (Percentage of viruses) | Comment |
|---|---|---|
| V1A.3(B/Washington/02/2019) | 0 (0 percent) | |
| V1A.3(B/Netherlands/11267/2022) | 0 (0 percent) | |
| V1A.3a.1 | 0 (0 percent) | |
| V1A.3a.2 | 95 (100 percent) | Genetic group affiliation of the recommended vaccine virus for northern hemisphere, season 2022–2023 and 2023-2024 (7, 9). The dominant (73 percent) genetic group among viruses reported within the European surveillance until week 20, 2023 (8). |
No antigenic analyses are performed at the PHAS. The general antigenic properties of the genetic groups have, however, been summarised in the report by the WHO in conjunction with the influenza vaccine composition recommendation meeting for the northern hemisphere 2023–2024 held in February 2023 (9, 10). The antigenic analyses with ferret antisera raised against the respective vaccine viruses included in the northern hemisphere vaccine for 2022–2023 are described in the following sections (9, 10).
Influenza A(H3N2)
Circulating viruses since Sept. 2022 belong to group 1: 3C.2a1b.2a.1 and group 2: 3C.2a1b.2a.2, the latter showing co-circulation of multiple subgroups (2a.2a, 2a.2b, 2a.2c and 2a.2d).Antisera raised against viruses similar to the vaccine virus A/Darwin/6/2021 or A/Darwin/9/2021 (genetic group 3C.2a1b.2a.2a) reacted well with viruses in the genetic subgroup2a.2a, while viruses in subgroup 2a.2b were recognized less well. The majority (71 percent) of the Swedish viruses belong to subgroup 3C.2a1b.2a.2a, and 29 percent to subgroup 2a.2b, see the phylogenetic tree for influenza A(H3N2).
Influenza A(H1N1)pdm09
Viruses circulating since September 2022 belong to group 6B.1A.5a.1 or 6B.1A.5a.2, with 6B.1A.5a.2 being the dominant group. This group has further evolved into subgroup 5a.2a and 5a.2a.1. Ferret antisera raised against the cell culture-propagated vaccine virus A/Victoria/2570/2019 or the egg-propagated vaccine virus A/Wisconsin/588/2019 (both genetic group 6B.1A.5a.2) reacted well against viruses in genetic group 6B.1A.5a.2 but poorly against the 6B.1A.5a.1 viruses. Human serum panels from vaccinated individuals showed that reactivity was reduced against recent A(H1N1)pdm09 of subgroup 5a.2a, 5a.2a.1, and 5a.1. Recommended vaccine viruses for the northern hemisphere 2023-2024 belong to subgroup 5a.2a.1. All Swedish viruses analysed belong to subgroups 5a.2a and 5a.2a.1.
Influenza B/Victoria
Circulating B/Victoria lineage viruses belong to group V1A.3. The majority of viruses in this group are designated subgroup V1A.3a, which has diversified into subgroup V1A.3a.1 and V1A.3a.2. Subgroup V1A.3a.2 is dominant in most of the geographic regions. Viruses in subgroup V1A.3a.2 were recognized well by antisera raised against the vaccine virus B/Austria/1359417/2021 (subgroup V1A.3a.2), and these results have been confirmed by human serology studies. Viruses in group V1A.3 were recognized less well. All analysed Swedish viruses belong to subgroup V1A.3a.2.
Antiviral susceptibility
The NA gene of 90 influenza A(H3N2), 102 influenza A(H1N1)pdm09, and 94 influenza B/Victoria viruses were sequenced and analysed for amino acid substitutions previously shown to be associated with reduced or highly reduced inhibition by the NA inhibitors oseltamivir and zanamivir. Of these, 285 viruses showed sensitivity to oseltamivir and zanamivir. In one A(H1N1)pdm09 virus, amino acid substitution N295S was detected as a minority variant. N295S is an amino acid substitution associated with reduced (AARI) or highly reduced (AAHRI) inhibition by oseltamivir. Additional phenotypic results are pending from both the PHAS and the WHOCC.
The PA gene of 87 A(H3N2), 100 influenza A(H1N1)pdm09, and 90 B/Victoria viruses was sequenced, and none of the amino acid substitutions previously shown to be associated with a >3-fold increase in IC50-value to baloxavir were detected.
The amino acid substitution S31N in the matrix protein, which confers resistance to amantadine, was present in all 199 Swedish influenza A viruses (94 A(H3) and 105 A(H1)pdm09). Additional amino acid substitutions associated with resistance to amantadine were observed in 10 influenza A(H1)pdm09 viruses. Seven carried amino acid substitution L26F, and three carried substitution V27A.
Virus isolation on cell culture
Influenza-positive samples for virus isolation on MDCK-SIAT1 cells were selected from samples collected through the sentinel sampling and from samples sent to the PHAS from the Swedish laboratories. Samples are selected for virus isolation based on genetic properties of the virus as determined by sequence analysis, geographical location, period of collection, and type/subtype/lineage type. In addition, samples of special interest are selected for virus isolation, for example, samples from severely ill or deceased patients, patients with vaccine break-through infections, and patients who do not respond to antiviral treatment. Samples with a Ct-value >30, as well as samples known to have been inactivated in the laboratory, are not selected for isolation. A total of 54 viruses (19 A(H3N2), 19 A(H1N1)pdm09, and 26 B/Victoria) were successfully isolated on MDCK-SIAT1 cells. Of these, 54 virus isolates along with 44 matching clinical samples were sent to the WHOCC London for further characterisation in January 2022 and July 2023.
Recommended vaccine composition
In February 2023, the WHO recommended that the quadrivalent vaccines for use in the northern hemisphere in the 2023–2024 season contain the following viruses (9).
Egg-based vaccines
The WHO recommends that the following viruses be included in egg-based vaccines:
- A/Victoria/4897/2022 (H1N1)pdm09-like virus
- A/Darwin/9/2021 (H3N2)-like virus
- B/Austria/1359417/2021 (B/Victoria lineage)-like virus
Cell-based or recombinant-based vaccines
The WHO recommends that the following viruses be included in cell-based or recombinant-based vaccines:
- A/Wisconsin/67/2022 (H1N1)pdm09-like virus
- A/Darwin/6/2021 (H3N2)-like virus
- B/Austria/1359417/2021 (B/Victoria lineage)-like virus
For quadrivalent egg- or cell culture-based or recombinant vaccines, WHO recommends the inclusion of a B/Yamagata lineage component: B/Phuket/3073/2013-like virus.
Vaccination coverage
There is no national register for influenza vaccinations in Sweden, but an estimate of the vaccination coverage among persons 65 years of age and older is made by each of Sweden’s 21 county medical officers for their respective regions (also known as county councils). Various methods for estimation have been used in different regions, see Comments on vaccination data.
Coverage among persons 65 years of age and older
The national vaccination rate among persons aged 65 and older was approximately 63 percent in 2022–2023, which was higher than the seasons before the pandemic but lower than the 2021–2022 season (see Figure 23). It is estimated that approximately 1.3 million people aged 65 and older were vaccinated this season. As in previous seasons, coverage was highest among people aged 85 and older (71 percent), followed by those aged 75–84 years (69 percent, see Table 16).
Figure 23. Vaccination coverage among persons aged 65 and older in Sweden, 2010–2011 to 2022–2023.
Vaccinations began at the end of October at long-term care facilities, where adjuvanted influenza vaccines were used. The public vaccination campaign started on November 9, 2022 (week 45), during which quadrivalent standard-dose vaccines were used. As in the previous season, concomitant administration of influenza and COVID-19 vaccines was possible.
Regional differences in vaccination coverage
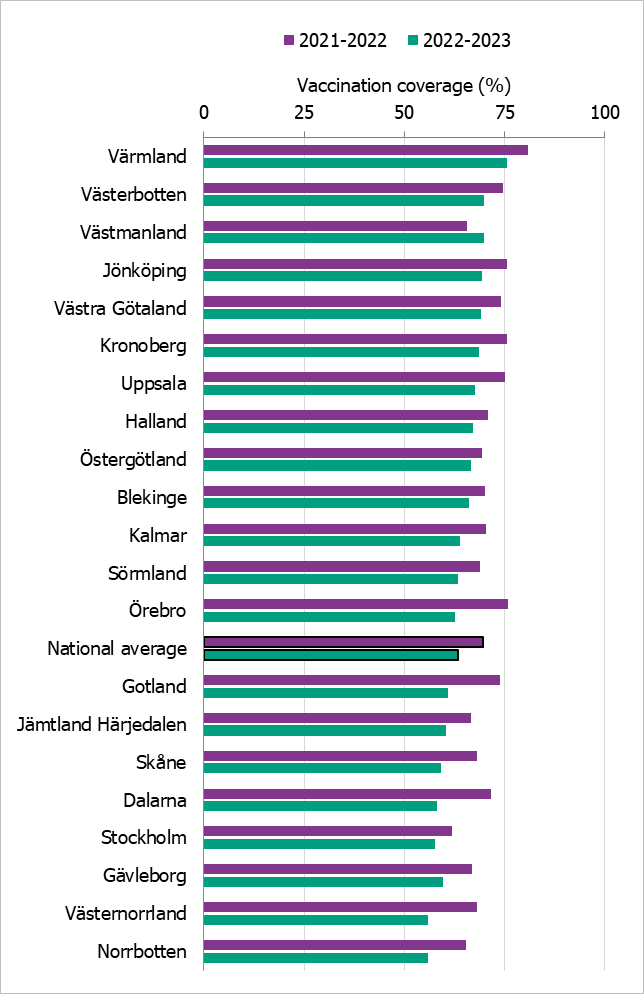
Comparisons among regions are difficult because estimates are based on different methods and there is uncertainty associated with each value. This season, nearly all regions had a lower vaccination coverage for the age group 65 years and older than the 2021–2022 season, but in most regions it was higher than the seasons before the COVID pandemic. Värmland was the only region to reach the WHO’s goal of 75 percent coverage. Västmanland increased coverage between the 2021–2022 and 2022–2023 seasons from 65 to 70 percent. Västerbotten also reached 70 percent coverage.
Figure 24 shows the vaccination rates for the age group 65 years and older per region over the past two seasons. For more regional data and collection methods, see the Swedish-language weekly report for weeks 19 and 20 of the 2022–2023 season (11).
Figure 24. Estimated proportion of vaccinated persons aged 65 and older per region in Sweden for seasons 2021–2022 and 2022–2023.
Vaccination coverage among persons under 65 years
It is difficult to estimate vaccination coverage among the medical risk groups under 65 years of age because these groups are hard to define and because data on risk group status is not usually collected. Sixteen regions (see Comments on vaccination data) have reported the number of persons vaccinated under 65 years of age, which gives an indication of the coverage. Coverage per age group for 2021–2022 and 2022–2023 from the twelve regions that reported both seasons are shown in Table 16. When all 16 reporting regions are included in coverage estimates for 2022–2023, coverage is slightly different for the following age groups: 18–39 years (2.3 percent), 40–64 years (7.0 percent), 65–74 years (53 percent) and 85 years and older (73 percent).
| Age group (years) | 0–17 | 18–39 | 40–64 | 65–74 | 75–84 | 85+ |
|---|---|---|---|---|---|---|
| Percentage vaccinated 2021–2022 (percent) | 0.34 | 2.7 | 8.5 | 61 | 74 | 75 |
| Percentage vaccinated 2022–2023 (percent) | 0.35 | 2.5 | 7.7 | 55 | 69 | 71 |
| Population (31 Dec 2022) | 1 149 747 | 1 549 936 | 1 702 496 | 551 234 | 418 278 | 141 108 |
Population data are updated each year, see Comments on vaccination data, and are shown here for 2022 as an indication of population size per age group in the included regions.
Comments on vaccination data
Data on vaccination coverage among persons 65 years of age and older have been collected by Sweden’s 21 county medical officers for their respective regions since 2003 and at the PHAS since 2014. Various methods for estimation have been used in different regions, including the use of vaccination registries, the number of vaccine doses given or distributed, sentinel reports on vaccination coverage, surveys among general practitioners, and patient record data. These methodological differences result in coverage estimates of varying quality and precision. Although the methods vary between regions, the methods within most regions have been roughly the same for the past several years, thus allowing a comparison over time.
An estimate of the vaccination coverage in age groups younger than 65 is included, using data from a subset of regions where registry data by age group are available throughout the season as well as annually. These data come from Dalarna, Gotland, Gävleborg, Halland, Jämtland Härjedalen, Jönköping, Kalmar, Kronoberg, Norrbotten, Skåne, Stockholm, Sörmland, Värmland, Västernorrland, Västmanland, and Östergötland. Data from Gotland, Dalarna, Halland and Skåne are excluded from Table 16 for increased comparability between seasons.
Vaccination coverage estimates were calculated using the population data from December 31 of each year (Source: Statistics Sweden), except for Dalarna where listed patients per age group were used instead. Changes in data sources and data excluded per region are noted in the Swedish language report published in June (11). For some regions, data sources do not include all doses given, e.g. doses given within municipal elderly care, at hospitals, or by private vaccination units.
Syndromic surveillance
Three systems of syndromic surveillance were used during the 2022–2023 influenza season – Webbsök (Web search), telephone calls to the national medical advice line 1177, and the web panel Hälsorapport (Health report). Webbsök is an automated system established in 2008 that uses a statistical model and anonymous search data from a medical advice website to estimate ILI incidence in primary care. Data are received daily and analysed weekly. The results are published on the web every Monday during the influenza season in the form of a graph (12), which is three days ahead of the publication of the weekly influenza bulletin.
In collaboration with the national medical advice line 1177, the PHAS receives aggregated weekly data on calls from a system called Hälsoläge. The age group and main reason for calling are registered for all callers. The reported data include the number of calls related to cough, fever, and sore throat. The proportion of calls related to fever in children has previously been found to be a good indicator of influenza activity in the community. Data from this source was unavailable to the PHAS during February–June 2023 due to technical migration of the system.
The system Hälsorapport (“Health report”) is a web-based reporting panel that helps the PHAS to get a picture of the Swedish population’s health and its views on health. It builds on the experience and knowledge gained from previous community-based surveillance systems used in Sweden as well as the Influenzanet network. Approximately 8,200 people aged 1 to 95 years participate in Hälsorapport are invited to respond to a health-related survey a few times a year. Between week 35, 2022, and week 24, 2023, participants received weekly surveys with questions on their health status for the preceding week. If the participants reported that they had fallen ill, they were asked to report their symptoms. Based on these reports, the PHAS was able to estimate the weekly cumulative notification rate of ARI and ILI in Sweden. In addition, participants were asked about certain measures of disease severity, such as healthcare-seeking behaviour and work or school absenteeism.
Web search data (Webbsök)
According to Webbsök, the 2022–2023 influenza season lasted for 7 weeks, from week 47, 2022, to week 1, 2023 (Figure 25), disregarding a false signal in week 45 during the start of the vaccination campaign. The influenza activity was at low or very low levels throughout most of the season and reached medium intensity in weeks 51 and 52. This peak coincided with the first peak for the laboratory-based surveillance (Figure 26). Between week 27, 2022, and week 26, 2023, a total of 291,966 queries related to influenza were entered, which was 4 percent of the total number of queries on the website 1177.se.
Figure 25. Webbsök’s estimated proportion of the population with ILI per week, 2022–2023.
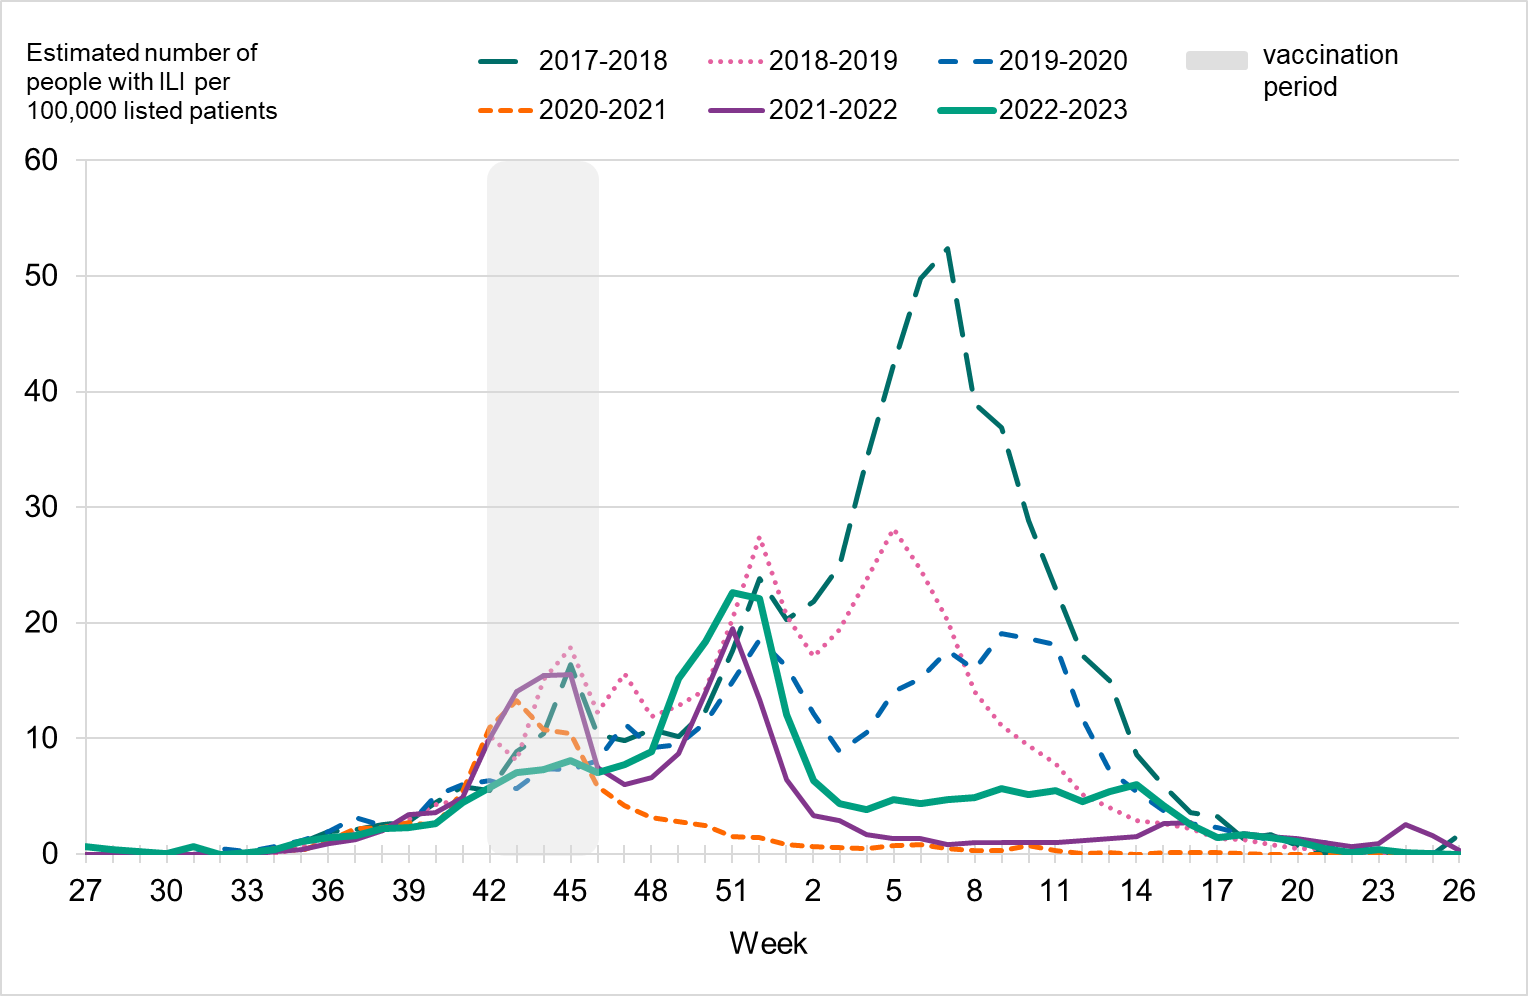
Note that the increased levels during weeks 41–45 (grey period) for some seasons are deemed to be due to searches related to influenza vaccination rather than increased influenza activity. The statistical model is sometimes affected by intensive media coverage and other factors that change how people search for information on 1177.se. Results from Webbsök should therefore be interpreted with some caution and should be seen as a complement to the PHAS’s traditional monitoring methods (e.g., laboratory-based and sentinel surveillance).
Figure 26. Webbsök’s estimated proportion of persons with ILI (incidence per 100,000 population) and the number of laboratory-confirmed cases, 2022–2023.
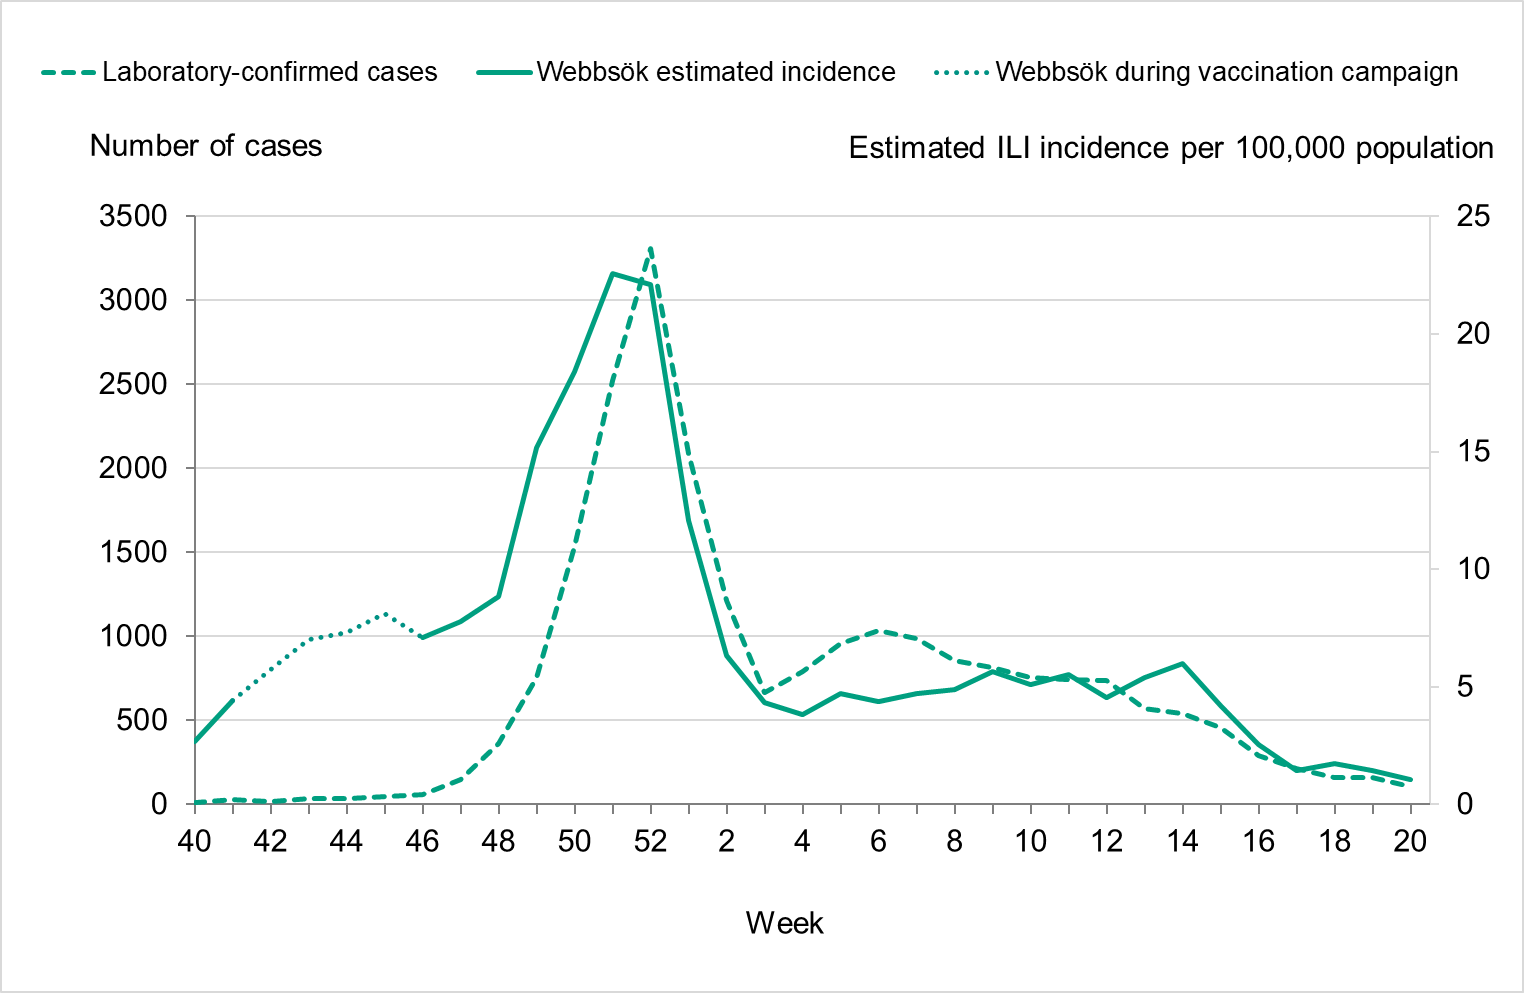
Telephone advice line data (Hälsoläge)
The percentage of calls to 1177 regarding fever in children (all ages) exceeded the epidemic threshold in week 42, 2022, and indicated a very high level of activity in weeks 50–52, 2022, using levels calculated based on data from pre-pandemic seasons. The percentage of calls about fever among children reached the highest level in week 51 at 14 percent, which was higher than the previous five seasons, see Figure 27 (two previous seasons shown). This metric for children aged 0–4 years also reached very high levels during the season (weeks 49–52, 2022), with 41 percent of calls in week 51. Fever among children is a non-specific indicator and can be due to causes other than influenza, not least COVID-19, which saw a peak in cases during this time. A noticeable peak in calls is often seen around the Christmas holidays every year, followed by a drop. The reason for this pattern might be decreased access to face-to-face healthcare services during the holidays leading to an increase in telephone consultations.
Data from the system was not available from February to June 2023 because of technical migration of the system. Intensity levels have not yet been calculated for the updated system in use from June 2023.
Figure 27. Percentage of telephone calls regarding fever in children received by the medical advice line 1177 for the past three seasons.
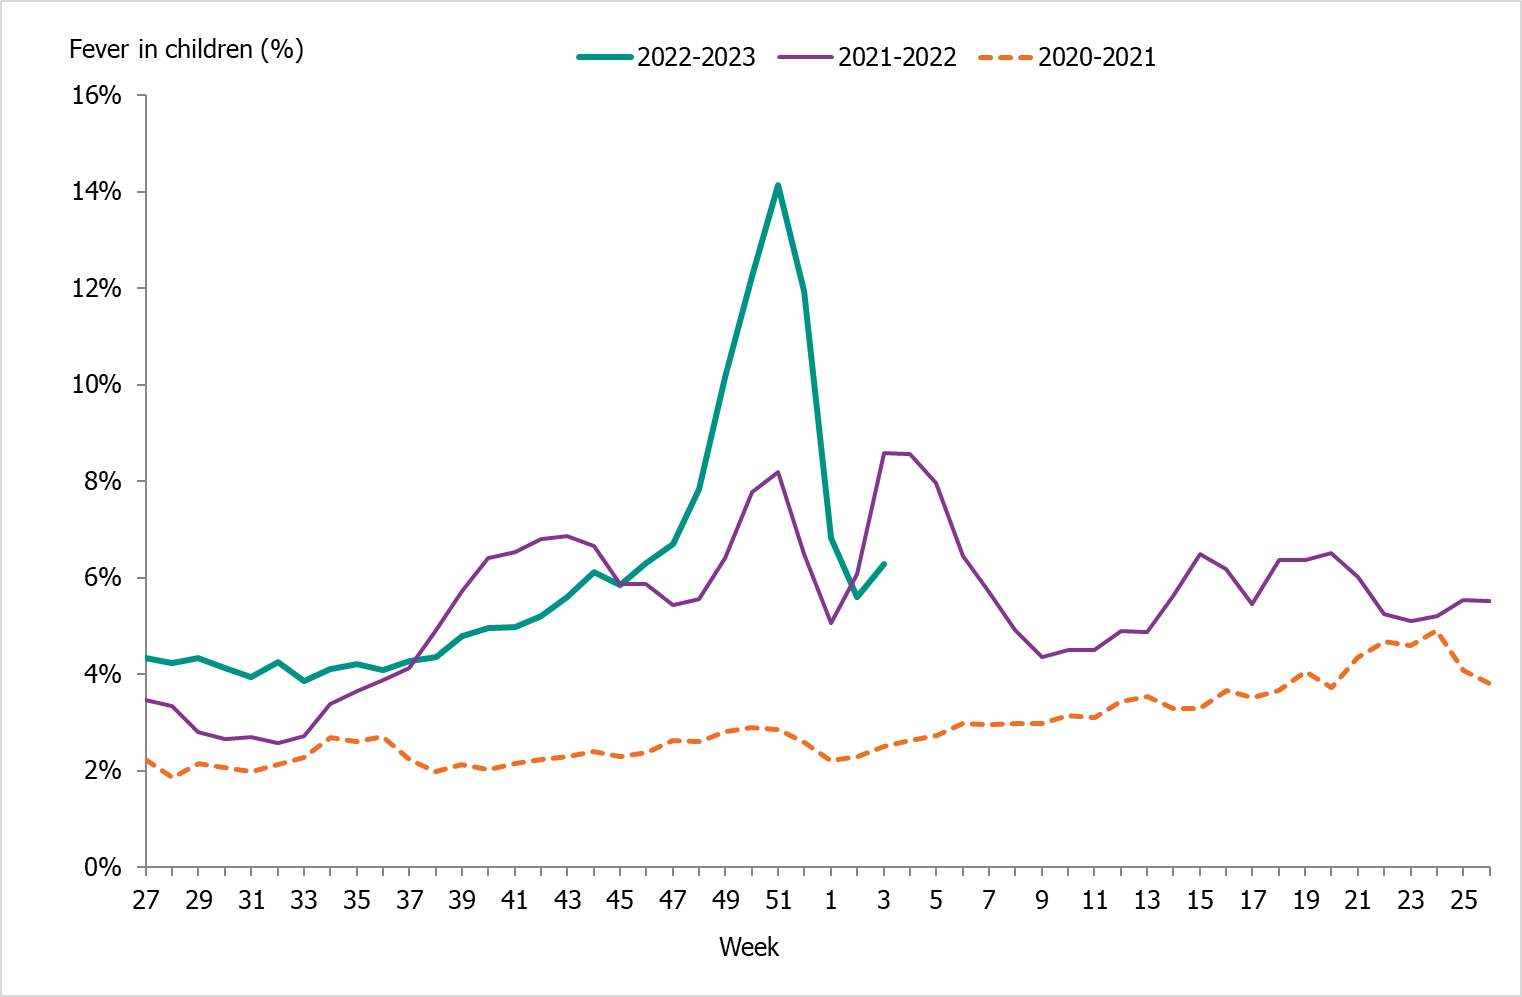
Weekly symptoms reporting (Hälsorapport)
Data from Hälsorapport show the highest levels of ILI during weeks 49 to 51, 2022, with around 3.5 percent of Sweden's population estimated to have fallen ill with ILI each week. During this time, COVID-19 cases reached the highest levels for the winter and influenza circulation was increasing. Laboratory-confirmed cases of influenza peaked in week 52, when around 2.4 percent of Sweden's population was estimated to have ILI, see Figure 29. The highest levels of ARI were also reported weeks 49 to 51, when 10.5–12.5 percent of the population was estimated to have fallen ill with ARI each week. In addition to the influenza epidemic, this period corresponds to high transmission of RSV and COVID-19.
Figure 29. Proportion of the Swedish population with ILI and percentage positive within laboratory reporting, per week, 2022–2023.
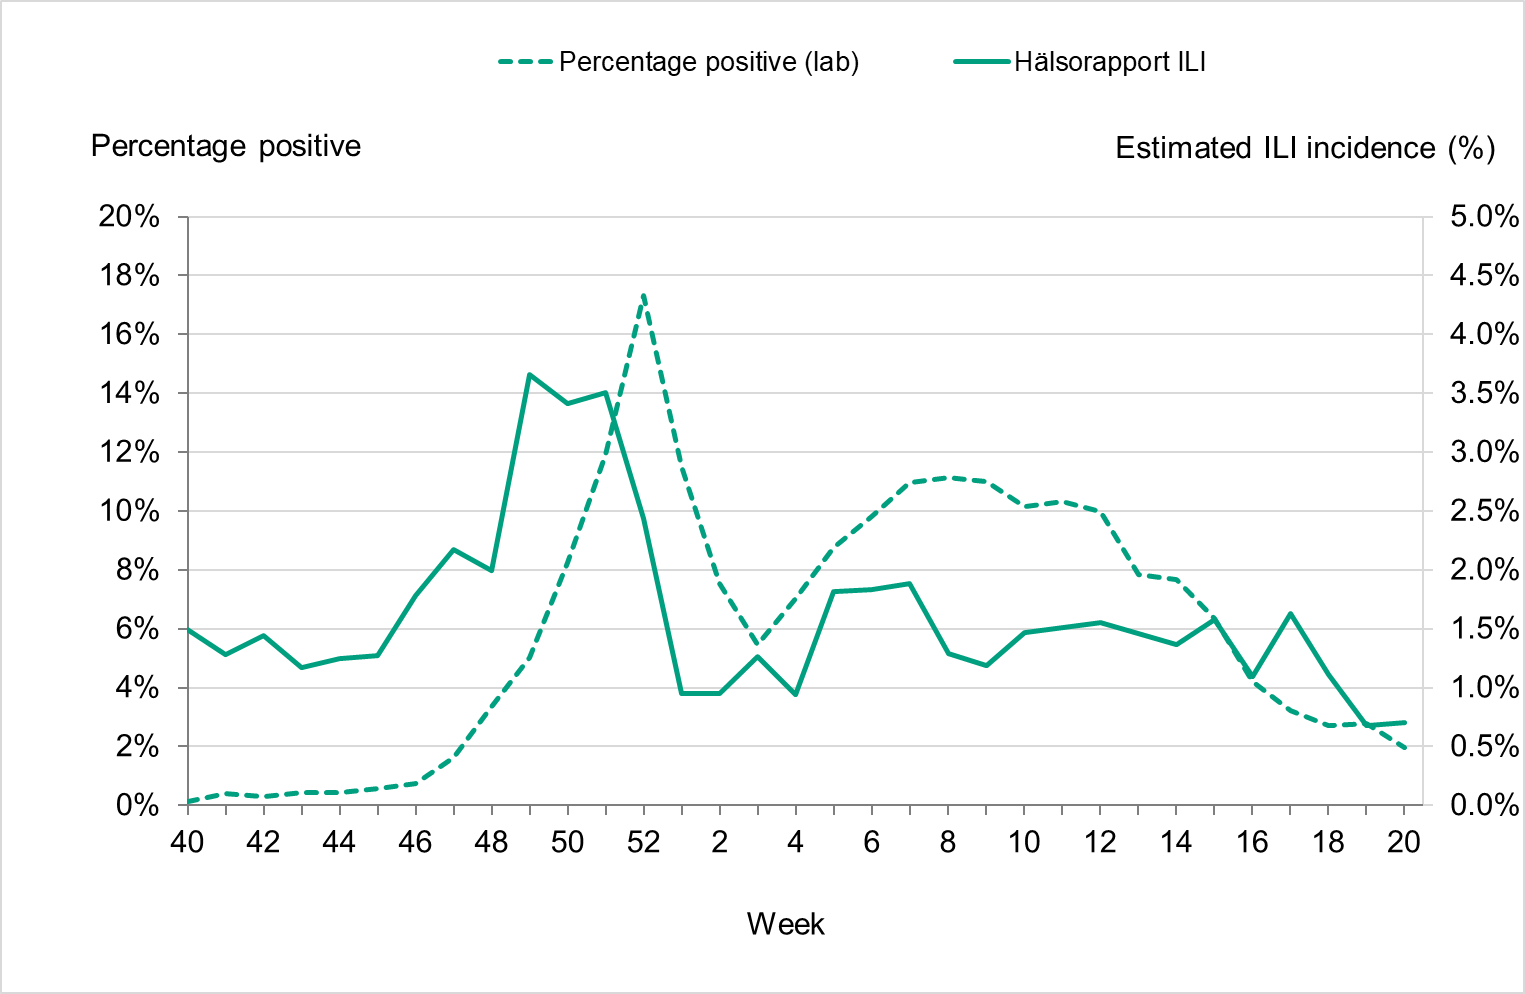
Quality assessment
External quality assessment programmes provide a comparison of method performance between laboratories and are a tool to ensure accurate laboratory testing. The PHAS takes part in several external programmes and produces a panel for other Swedish laboratories. Surveillance is dependent on such standardised methods.
At the PHAS, one-step real-time RT-PCR assays are used detect influenza A and B, to subtype influenza A-positive samples, and to discriminate between the two influenza B lineages. These assays have also been optimized, implemented, and evaluated for avian influenza diagnostics. This is essential because these assays are sensitive, rapid, and can be scaled up if necessary. The PHAS continuously monitors the genomic sequences of circulating influenza strains in order to detect mutations that could affect the sensitivity of the PCR assays. The PHAS also performs in silico (computational) validation of each assay twice a year, both before and during the peak of the influenza season.
Every year the PHAS produces a PCR panel for Swedish laboratories on behalf of the External Quality Assessment for Clinical Laboratory Investigations (EQUALIS). This allows laboratories to measure the analytical sensitivity and specificity of their methods. The majority of the laboratories performing diagnostics for influenza use commercial PCR kits. A number of these laboratories participate in additional quality controls during the season in order to ensure that circulating influenza strains are detected with these kits.
National quality assessment programme for influenza PCR
In September 2022, the PHAS produced a new PCR panel for Swedish laboratories, which was distributed by EQUALIS. Twenty-six laboratories participated in the panel that included ten samples in total: seven influenza A and three influenza B (the cycle threshold value range was 21–34 when analysed with the in house PCR method at the PHAS), and all of them reported 10/10 correct results.
Control of commercial PCR kits
Commercial PCR kits for influenza detection are widely used for diagnostic purposes. Each fall, ahead of the influenza season, a survey is conducted to determine which PCR kits are being used by Swedish clinical microbiology laboratories. The survey also presents the option to participate in a panel in order to ensure that the PCR kits that are used are able to detect the currently circulating influenza strains.
For the 2022–2023 season, 15 laboratories responded to the survey. All responding laboratories used commercial PCR kits (some in combination with in house methods). Six laboratories, using in total 12 different commercial PCR kits, were selected to receive the panel.
The following kits were evaluated:
- Xpert® Xpress CoV-2/Flu/RSV plus (Cepheid)
- Xpert® Xpress SARS-CoV-2/Flu/RSV (Cepheid)
- ALINITY m RESP-4-PLEX ASSAY (Abbott)
- BIOFIRE® FILMARRAY® Respiratory 2.1 plus Panel (BioMerieux)
- LightMix Modular Influenza A + Influenza B (Roche)
- BD MAX (BD) VIASURE Flu A, Flu B & RSV (Certest)
- VitaPCR™ (SARS-CoV-2)/Flu A/B & RSV* (Credo Diagnostics)
- NeuMoDx Flu A-B/RSV/SARS-CoV-2 Vantage Test (Qiagen)
- QIAstat-Dx Respiratory SARS-CoV-2 Panel (Qiagen)
- Amplidiag® RESP-4 (Mobidiag)
- GenomEra SARS-CoV-2, Flu A/B + RSV Assay Kit (Abacus Diagnostica)
- Panther fusion (Hologic)
The panel consisted of ten samples, including four A(H1N1)pdm09, four A(H3N2), and two B/Victoria samples. The cycle threshold values, when analysed with the in house PCR-method at the PHAS, varied between 25 and 32.
Earlier in the season, problems with influenza A PCR detection were reported from various parts of Europe, where different methods had issues detecting influenza A(H1N1)pdm09 and A(H3). Two of the samples in the panel resembled these viruses, with genetic changes in the matrix gene of A(H1N1)pdm09 and A(H3). These could not be detected by two of the commercial kits. For one of the kits, there is a version 2.0 that was not evaluated with this panel. The laboratory using the other kit subsequently carried out an internal investigation that confirmed the low sensitivity, and in combination with other factors this resulted in the decision to use an alternative kit for influenza detection.
A summary of panel results was presented on the PHAS website in order to inform other laboratories about the results.
In the event of methodological issues with clinical samples, Swedish clinical microbiology laboratories are welcome to contact the PHAS to compare their results or to obtain sequence data for further investigation.
External quality assessment programmes
The PHAS participated in two external quality assessment programmes during 2022, including the “Annual WHO External Quality Assessment Programme for influenza” from the WHO and the “QCMD 2022 Influenza virus A and B RNA external quality assessment programme” from the QCMD (Quality Control for Molecular Diagnostics). The results are summarised below.
Annual WHO External Quality Assessment Programme for influenza
The PHAS participated in the annual WHO External Quality Assessment Panel for influenza (no. 21) during 2022.
Molecular detection, typing, and sub/lineage-typing
Ten samples analysed by real-time PCR were correctly typed (A, B, or negative). Six of these were influenza A, with subtypes A(H1)pdm09, A(H3), A(H5), and A(H7) detected. Two influenza A samples could not be subtyped with real-time PCR, but whole-genome sequencing suggested they were subtype A(H9), and this was confirmed in the final report. This procedure follows the routine protocol at the PHAS in cases where the influenza A subtype cannot be established but where virus titres are high enough for further investigation.
Genotyping and phenotypic antiviral susceptibility determination
Genotyping analysis of the NA gene was performed by NGS on an Ion Torrent platform, and the results were correct for all three samples (two A(H3N2) and one A(H1N1)pdm09) included in the programme. Phenotypic analysis was performed using a MUNANA-based NAI assay (fluorescence-based), and the results were correct for all three samples (same samples as above).
QCMD 2022 Influenza virus A and B RNA external quality assessment programme
Real-time PCR accurately detected the correct type, subtype, and lineage in all ten samples analysed. Subtyping and lineage typing identified influenza A(H1)pdm09, A(H3), B/Victoria, and B/Yamagata.
References
- Public Health Agency of Sweden. Publikationer [Publications]. [Internet]. Stockholm: Public Health Agency of Sweden; 2022 [cited 2022-08-29] Available from: http://www.folkhalsomyndigheten.se/publicerat-material/publikationer/
- Public Health Agency of Sweden, Aktuell influensarapport [Current Weekly Report]. [Internet]. Stockholm: Public Health Agency of Sweden; 2023 [cited 2023-07-24] Available from: https://www.folkhalsomyndigheten.se/folkhalsorapportering-statistik/statistik-a-o/sjukdomsstatistik/influensa-veckorapporter/aktuell-veckorapport-om-influensa/
- Public Health Agency of Sweden, Current recommendations for influenza vaccination of risk groups. [Internet] Stockholm: Public Health Agency of Sweden; 2021 [cited 2023-08-15]. Available from: https://www.folkhalsomyndigheten.se/publicerat-material/publikationsarkiv/r/rekommendationer-om-influensavaccination-till-riskgrupper/
- Vega T, Lozano JE, Meerhoff T, Snacken R, Mott J, Ortiz de Lejarazu R, Nunes B. Influenza surveillance in Europe: establishing epidemic thresholds by the moving epidemic method. Influenza Other Respir Viruses. 2013 Jul;7(4):546-58. doi: 10.1111/j.1750-2659.2012.00422.x. Epub 2012 Aug 16. PMID: 22897919; PMCID: PMC5855152. https://www.ncbi.nlm.nih.gov/pmc/articles/PMC5855152/
- Swedish Medical Products Agency (Läkemedelsverket), Behandling och profylax vid influensa – behandlingsrekommendation [Treatment and prophylaxis of influenza – treatment recommendation]. [Internet] Uppsala: Medical Products Agency: 2022 [cited 2023-08-17]. Available from: https://www.lakemedelsverket.se/sv/behandling-och-forskrivning/behandlingsrekommendationer/sok-behandlingsrekommendationer/behandling-och-profylax-vid-influensa-behandlingsrekommendation
- VEBIS Kissling Esther, Maurel Marine, Emborg Hanne-Dorthe, Whitaker Heather, McMenamin Jim, Howard Jennifer, Trebbien Ramona, Watson Conall, Findlay Beth, Pozo Francisco, Bolt Botnen Amanda, Harvey Ciaran, Rose Angela, European IVE group. Interim 2022/23 influenza vaccine effectiveness: six European studies, October 2022 to January 2023. Euro Surveill. 2023;28(21):pii=2300116. https://doi.org/10.2807/1560-7917.ES.2023.28.21.2300116
- World Health Organization, Recommended composition of influenza virus vaccines for use in the 2022–2023 northern hemisphere influenza season. [Internet]. Geneva: World Health Organization; 2022. [published 2022-02-25, cited 2023-07-26]. Available from: https://www.who.int/news/item/25-02-2022-recommendations-announced-for-influenza-vaccine-composition-for-the-2022-2023-northern-hemisphere-influenza-season
- European Centre for Disease Prevention and Control/World Health Organisation Regional Office for Europe. Flu News Europe, Joint ECDC–WHO weekly influenza update, week 20/2023. [Published on 2023-05-26, cited 2023-07-26]. Available from: se https://flunewseurope.org/Archives
- World Health Organization, Recommended composition of influenza virus vaccines for use in the 2023–2024 northern hemisphere influenza season. [Internet]. Geneva: World Health Organization; 2023. [published 2023-02-24, cited 2023-07-26]. Available from: https://www.who.int/publications/m/item/recommended-composition-of-influenza-virus-vaccines-for-use-in-the-2023-2024-northern-hemisphere-influenza-season
- Worldwide Influenza Centre, WHO CC, Report prepared for the WHO annual consultation on the composition of influenza vaccines for the Northern Hemisphere 2023-2024. [Internet]. London: Francis Crick Institute; 2023. [published February 2023, cited 2023-08-17]. Available from: https://www.crick.ac.uk/sites/default/files/2023-03/F2023-VCM-seasonal_web.pdf
- Public Health Agency of Sweden, Influensa veckorapport vecka 19-20, säsongen 2022-2023 [Influenza Weekly Report for week 19-20, season 2022-2023]. [Internet]. Stockholm: Public Health Agency of Sweden; 2023 [cited 2023-07-24] Available from: https://www.folkhalsomyndigheten.se/folkhalsorapportering-statistik/statistik-a-o/sjukdomsstatistik/influensa-veckorapporter/arkiv-for-influensa-veckorapporter/arkiv-2022-2023/influensarapport-vecka-19-20-sasongen-2022-2023/
- Public Health Agency of Sweden, Webbsök för influensa [Web search for influenza] [Internet]. Stockholm: Public Health Agency of Sweden; 2022 [cited 2023-08-29] Available from: https://www.folkhalsomyndigheten.se/folkhalsorapportering-statistik/statistik-a-o/sjukdomsstatistik/influensa-veckorapporter/webbsok-for-influensa/
- Norwegian Institute of Public Health, Influenza Virological and Epidemiological season report prepared for the WHO Consultation on the Composition of Influenza Virus Vaccines for the Southern Hemisphere 2023, September 2022 2023 [cited 2023-08-18] Available from: https://www.fhi.no/ss/influensa/influensaovervaking/who-rapporter/
- Region Stockholm, Influensasäsongen 2022/2023 [The 2022-2023 Influenza Season]. [Internet] Stockholm: Region Stockholm; 2023. [cited 2023-08-17]. Available from: https://vardgivarguiden.se/globalassets/kunskapsstod/smittskydd/influensa/influensasasongen-rapport-2022-2023.pdf
- L.T. Cooper, Myocarditis, N Engl J Med, 360 (2009), pp. 1526-1538.
- Zahra Raisi Estabragh, Mamas A. Mamas, The cardiovascular manifestations of influenza: A systematic review, International Journal of Cardiology, Volume 167, Issue 6, 2013, Pages 2397-2403, ISSN 0167-5273, https://doi.org/10.1016/j.ijcard.2013.01.274.
- Tschöpe C, Ammirati E, Bozkurt B, Caforio ALP, Cooper LT, Felix SB, Hare JM, Heidecker B, Heymans S, Hübner N, Kelle S, Klingel K, Maatz H, Parwani AS, Spillmann F, Starling RC, Tsutsui H, Seferovic P, Van Linthout S. Myocarditis and inflammatory cardiomyopathy: current evidence and future directions. Nat Rev Cardiol. 2021 Mar;18(3):169-193. doi: 10.1038/s41569-020-00435-x. Epub 2020 Oct 12. PMID: 33046850; PMCID: PMC7548534.
- Moore DL, Vaudry W, Scheifele DW, Halperin SA, Déry P, Ford-Jones E, Arishi HM, Law BJ, Lebel M, Le Saux N, Grimsrud K, Tam T. Surveillance for influenza admissions among children hospitalized in Canadian immunization monitoring program active centers, 2003-2004. Pediatrics. 2006 Sep;118(3):e610-9. doi: 10.1542/peds.2005-2744. PMID: 16950953.
- Bratincsák, A, El-Said, HG, Bradley, JS, et al. Fulminant myocarditis associated with pandemic H1N1 influenza A virus in children. Am J Cardiol 2010; 55: 928–929.
- Randolph AG, Vaughn F, Sullivan R, Rubinson L, Thompson BT, Yoon G, Smoot E, Rice TW, Loftis LL, Helfaer M, Doctor A, Paden M, Flori H, Babbitt C, Graciano AL, Gedeit R, Sanders RC, Giuliano JS, Zimmerman J, Uyeki TM; Pediatric Acute Lung Injury and Sepsis Investigator's Network and the National Heart, Lung, and Blood Institute ARDS Clinical Trials Network. Critically ill children during the 2009-2010 influenza pandemic in the United States. Pediatrics. 2011 Dec;128(6):e1450-8. doi: 10.1542/peds.2011-0774. Epub 2011 Nov 7. PMID: 22065262; PMCID: PMC3387899.
- K.G. Nicholson, R. Webster, A. Hay (Eds.), Textbook of influenza, Blackwell Science, Oxford England (1997), pp. 219-263
- Steininger C, Popow‐Kraupp T, Laferl H, et al. Acute encephalopathy associated with influenza A virus infection. Clin Infect Dis. 2003;36:567‐574.
- Sellers SA, Hagan RS, Hayden FG, Fischer WA 2nd. The hidden burden of influenza: A review of the extra-pulmonary complications of influenza infection. Influenza Other Respir Viruses. 2017 Sep;11(5):372-393. doi: 10.1111/irv.12470. PMID: 28745014; PMCID: PMC5596521.
- Goenka A, Michael BD, Ledger E, et al. Neurological manifestations of influenza infection in children and adults: results of a National British Surveillance Study. Clinical Infect Dis. 2014;58(6):775‐84
- Glaser CA, Winter K, DuBray K, et al. A population‐based study of neurologic manifestations of severe influenza A (H1N1) pdm09 in California. Clin Infect Dis. 2012;55:514‐520.
- Mizuguchi M. Influenza encephalopathy and related neuropsychiatric syndromes. Influenza Other Respir Viruses. 2013;7:67‐71.
Appendix 1. Investigation of severe complications of influenza B among adolescents
During March 2023, five cases of influenza B associated with severe extra-respiratory complications were reported in Örebro region (population just over 300,000), located in south central Sweden. An epidemiological link was identified among three cases. The initial cases were among people under the age of 20 without underlying conditions who presented with severe myocarditis or encephalitis. Although myocarditis and encephalitis are known, but unusual, complications of influenza infection, the initial epidemiological cluster prompted activities at the regional level and a national investigation.
Aim and activities
The investigation aimed to identify any other cases of influenza B with severe complications (in all ages), as well as to assess whether the number of influenza B cases with severe complications was higher than expected and whether there was any common contributing cause beyond influenza infection or any possible viral factors associated with the observed severe complications.
Activities within the investigation included:
- Regional case finding using the case definition below. The PHAS also requested labs to send samples for sequencing.
- Follow up of severe influenza B cases and analysis of COVID-19 vaccination status and previous laboratory-confirmed COVID-19 infection.
- Communication with epidemiological and virological colleagues and agencies within Europe.
- Review of national and regional data on previous seasons.
- Literature search on rates of influenza-associated complications of myocarditis or encephalitis among children and possible risk factors.
- Literature search on viral factors (genomic markers) associated with myocarditis or encephalitis.
- Communication through spokespersons and via weekly influenza reports.
- Virological investigation.
Case definition
The following case definitions were used to identify cases from the 2022–2023 season for inclusion in the investigation.
A confirmed case was a patient with confirmed influenza B infection (a), regardless of age, who has sought care in Sweden with one of the following severe complications from Oct 1, 2022, onward:
- Myocarditis (b)
- Encephalitis/meningitis/meningoencephalitis (c)
A suspected case was a patient with influenza-like illness, regardless of age, who has sought care in Sweden without a confirmed influenza diagnosis, but where another cause has not been found, and with one of the following severe complications, from Oct 1, 2022, onward:
- Myocarditis (b)
- Encephalitis/meningitis/meningoencephalitis (c)
(a) ICD-10 codes: J10, J11 or laboratory report in SmiNet.
(b) ICD-10 codes: I40, I41.
(c) ICD-10 codes: G04, G05, A85, A86, A87, A88, A89.
Epidemiological results
Identified cases
The investigation identified further cases with serious complications in scattered regions within Sweden. Among these, a second small cluster was detected in a region geographically separate from the first (Jämtland Härjedalen). In total, 17 confirmed and three suspected cases in all ages were identified, notified from December to May, see Figure 30. Ten cases were female and ten were male, and age groups ranged from 0–10 years to 60–69 years, with a median age of 18 years. Ten cases had myocarditis, of which six were under 20 years of age, and ten cases had encephalitis, of which five were under 20 years of age. The majority of cases (n = 12) received intensive care, including several in ECMO (n = 4). Three cases died.
Figure 30. The number of confirmed and suspected influenza cases with severe outcomes included in the investigation and the total number of influenza B cases per month of influenza sampling, 2022–2023.
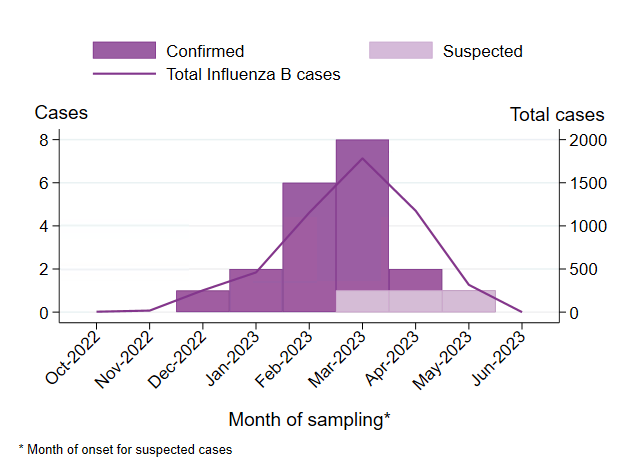
Influenza vaccination status
Data on influenza vaccination status is missing for most investigated cases, but it is likely that most cases were not vaccinated because they did not belong to risk groups recommended vaccination. Influenza vaccination is not recorded in the National Vaccination registry, and availability of data on the regional level varies, see also Vaccination coverage.
COVID-19 vaccination status
Analysis of the COVID-19 vaccination status of cases under investigation showed no association or common factor among cases in terms of influenza infection and: vaccination status, type of COVID-19 vaccine, vaccine batch, dose number, or timing of COVID-19 vaccination in reference to onset of influenza. In total, 15 of 19 cases included in the analysis had been vaccinated with at least one dose of COVID-19 vaccine, and all vaccinated cases were 12 years of age or older when they received their first vaccine dose. Most vaccinated cases had received two doses (n = 11), while a few had received one dose (n = 2) or three doses (n = 2). The latest date of vaccination was May 25, 2022. On the whole, these data reflect vaccine recommendations in Sweden.
Previous COVID-19 infection
Data on notified (laboratory-confirmed) cases of COVID-19 give some information on COVID-19 infection among the population. However, most mild cases of COVID-19 would not have been tested during the 2022–2023 season. Discussions with clinicians treating the cases gave no indication that any had recent COVID-19 infection, and a review of the data on mandatory laboratory reports of COVID-19 cases showed that none of the investigated influenza cases had a laboratory-confirmed COVID-19 infection in the months leading up to the influenza infection.
Risk factors for severe complications
Assessments of cases did not reveal any common risk factors or additional etiological factors associated with the development of myocarditis or encephalitis in children with influenza infection, see the Review of literature section.
Virological results
Virological analyses and sequencing of the hemagglutinin (HA) gene showed that all Swedish influenza B strains characterized during the 2022–2023 season, including samples from the severe investigated cases, belonged to the same genetic group of B/Victoria (V1A.3a.2). Sequence data did not support genetic clustering of the severe cases. Sequences from patients with severe complications were distributed over different branches of the HA tree and were similar to samples collected from other patients (not reported with severe complications), and similar patterns were observed for the other gene segments such as neuraminidase (NA) and non-structural protein (NS). The same genetic group (V1A.3a.2) dominated the circulation of influenza B in Europe during the season and was included in the season's influenza vaccines, see also the Virus characterization section.
Further virological investigations at the PHAS include ongoing whole genome analysis of the influenza B/Victoria subtype, including the viruses detected in samples obtained from the severe cases, and will consider any reported genomic markers, as noted in the literature search section.
Collaboration and communication
Our investigation has not found similar clusters in other European countries during the 2022–2023 season and no reports of increased severity of influenza B were found globally. Timely communication was possible because communication channels between the regional, national, and international levels were already established and in use before the investigation began.
Regional vaccination offer
In Sweden, influenza vaccination is only recommended to children if they belong to a risk group for severe illness. Part of the regional response in Region Örebro was to offer vaccination of children 6–17 years free of charge (inactivated quadrivalent vaccine). The offer of vaccination was seen as important in terms of health equity for families in the affected community. Because influenza B was circulating widely at this point in the season, it was determined unlikely that any actions taken would have an effect on influenza transmission.
Historical data on influenza B
Sweden has seen transmission of influenza B, mainly B/Victoria, during four of the past eight seasons and only a small number of cases in remaining seasons. The latest intense influenza B season was 2017–2018, when B/Yamagata caused an intense epidemic affecting all ages. Infection with B/Yamagata provides limited immunity against B/Victoria. No seroepidemiological study has been conducted in Sweden in recent years, but Norway has a seroepidemiological program to follow population immunity against circulating influenza viruses (13). Although influenza circulation sometimes differs between the two neighbouring countries, this gives an indication of immunity levels in the Swedish population. Prevalence of antibodies against recent variants of B/Victoria in 2022 was 10 percent overall, lower among children 0–4 years (6 percent).
A review of data on patients with laboratory-confirmed influenza B reported from intensive care units from 2015–2016 to 2022–2023 showed that a small number of patients under the age of 20 had been reported with cardiac or neurological complications during seasons with substantial influenza B circulation. Data on the 2022–2023 season show a higher number of patients under 20 years of age with influenza B in intensive care and a higher number of patients under 20 of age in intensive care with cardiac or neurological complications, compared with data going back to season 2015–2016, proportionate to the higher number of laboratory-confirmed cases seen this season, see Table 17.
| Indicator | 2015–2016 | 2017–2018 | 2019–2020 | 2022–2023 |
|---|---|---|---|---|
| Laboratory-confirmed cases | 634 | 1,396 | 1,102 | 1,931 |
| ICU patients with influenza B | 15 | 21 | 20 | 32 |
| ICU patients with influenza B and cardiac or neurological complications | 5 | 4 | 5 | 9 |
| Circulating influenza B lineage | B/Victoria | B/Yamagata | B/Victoria | B/Victoria |
In addition, the office of the County Medical Officer in Region Stockholm compiled descriptive data on laboratory-confirmed influenza A and B cases in Stockholm and patients hospitalised for myocarditis or encephalitis, with data on influenza vaccination status and underlying risk factors, for seasons 2016–2017 to 2022–2023. The results indicated that the numbers of myocarditis and encephalitis cases during the 2022–2023 season were no higher than other seasons. The proportion of myocarditis among influenza B cases was similar to the intense 2017–2018 B/Yamagata season. Overall, cases of myocarditis and encephalitis among laboratory-confirmed influenza cases under 18 years of age were rare, with data showing between zero and two cases of each complication per season in Stockholm. See also Region Stockholm’s report on the 2022–2023 influenza season (14).
Review of the literature
Risk factors associated with myocarditis or encephalitis in children with influenza infection
A review of the scientific literature was performed with the aim to identify reported frequencies of occurrence of influenza associated myocarditis and encephalitis. The review included scientific articles indexed in PubMed and used search keywords and medical subject headings (MeSH) terms related to ‘influenza’ and the ‘frequency’/’epidemiology’ of occurrence of its severe extra pulmonary complications ‘myocarditis’ and ‘encephalitis’. The search for overall frequencies of occurrence of myocarditis in influenza cases identified 141 abstracts, of which 9 were reviewed in full. For myocarditis in children a total of 56 abstracts were screened, with only 3 manuscripts reporting frequencies from cohort studies. For the occurrence of influenza-associated encephalitis, 4 studies discussing epidemiological data were reviewed (out of 175 abstracts, most being case reports). Most studies only include data regarding influenza A infections.
Both myocarditis and encephalitis are known extra-pulmonary complications of influenza infections. The actual incidence of influenza-related myocarditis in the general population is unknown because of its variable clinical presentation (15, 16) and because of variable indications and methods of diagnosis and screening (17). A small number of cohort studies report frequencies between 0.5-5 percent of myocarditis in children hospitalized with influenza (18, 19, 20), primarily from data on the influenza A (H1N1)pdm09 pandemic of 2009. Myocardial involvement in influenza cases is likely more common, with possibly around 10 percent or more of all influenza cases having some level of myocardial involvement (16, 21). It is therefore likely to be underdiagnosed. Fulminant myocarditis is believed to be uncommon, although post-mortem studies of influenza A infection suggest that it might also be underreported (16). Influenza-associated encephalitis may, according to a small number of scientific articles, occur in about 1–1.5 percent of children and up to 4 percent of adults hospitalized with influenza (18, 22, 23, 24, 25, 26). Few publications exist on rates of complications in children for influenza B or by influenza subtype and lineage, outside of influenza A(H1N1)pdm09.
Known etiological factors for fulminant myocarditis include, besides viral infections, infections with other pathogens; genetic factors (e.g. genetically predisposed heart-disease); environmental, lifestyle, and behavioural factors, including medication and drug use and, possibly, nutritional factors; medical conditions including autoimmune disease; certain allergies; and age and gender. The precise interaction of different factors, including the possibility of myocarditis being caused by multiple aetiologies (i.e. influenza infection and another factor) remains to be described.
Comorbidity and pre-existing diseases, especially neurodevelopmental disorders, are associated with an increased risk of influenza-associated neurological complications, although the absence of underlying diseases or other risk factors does not mean one cannot develop an influenza-associated central nervous system complication.
Virological markers associated with myocarditis, encephalitis or myositis in influenza infection
A review of the scientific literature was performed with the aim of identifying genomic markers in either influenza A or B viruses reported to be associated with the complications observed in severe cases. The review included scientific articles indexed in PubMed and published in the last ten years (2013–2023), and it used search keywords and medical subject headings (MeSH) terms related to virulence, influenza, and the relevant complications, i.e., myocarditis, encephalitis, and myositis (the latter being at times reported among the severe cases). In total, 140 abstracts were screened leading to 50 full-text reviews.
The HA segment was the most frequently described segment in the literature with regards to the complications, followed by the RNA polymerase genes (PA, PB1 and PB2), and the NA segment. Other segments were not common in the search results. Most genomic markers described in the literature were reported in avian-associated subtypes of influenza A (e.g., H3, H4, H5, H7, H9 and H10), followed by influenza A H1 subtypes. In contrast, only a small number of articles about influenza B were found.
The results of the review revealed frequent reporting of genomic markers associated with neurological findings such as neurotropism, neurovirulence, encephalitis, and neuroinflammation, primarily in influenza A subtypes of avian origin (infecting human or avian hosts or in mice as an animal model), and to a lesser extent in H1 subtypes. Contrary to the observed number of neurological reports, myocarditis and other heart conditions were rarely found, and myositis was almost absent in influenza A studies. Other genetic markers were associated with non-specific pathogenicity, such as enhanced viral growth, enhanced viral binding, increased viral replication efficacy, higher disease severity, or higher mortality, but studies did not refer to the target complications specifically. These markers associated with non-specific pathogenicity were abundant in influenza A reports and to some degree also in influenza B. We found that influenza B reports either referred to non-specific pathogenicity or described the target complications but lacked follow-up analysis of the viral genome. Communication with virological experts globally confirmed that little is known about factors linked to virulence in influenza B.
Conclusions
Based on the epidemiological investigations, the number of influenza B cases with severe complications during the 2022–2023 season in Sweden was not higher than expected during a period of intense influenza transmission. Although severe cases are expected during influenza epidemics, the initial epidemiological cluster of severe cases remains unusual. Taking into account the generated evidence, the cluster cannot be explained beyond the overall high levels of influenza B/Victoria transmission among children during the 2022–2023 season. Similarly, the microbiological investigations did not identify viral factors that could be associated with severity.
Low levels of immunity, particularly in children (13), against B/Victoria possibly increased transmission and the intensity of this season’s influenza B epidemic among children. The effect of the COVID-19 pandemic on the circulation of other respiratory pathogens, including influenza, has been great and has, at least temporarily, changed the patterns and severity of influenza seasons.
