
Influenza in Sweden – Season 2021–2022
Summary
The 2021–2022 influenza season was unusual with two epidemic waves separated by a period of very low influenza activity. This period coincided with the first, intense wave of infection with the Omicron variant of SARS-CoV-2 in Sweden. Subtyping of samples within the laboratory reporting and sentinel surveillance showed that influenza A(H3N2) dominated the season. Altogether, the first wave is considered to have been at a medium level of activity and the second wave at a low level. In total, just over 13,000 laboratory-confirmed influenza cases were reported in the 2021–2022 season.
The spread and surveillance of influenza have both been affected by the COVID-19 pandemic since March 2020, particularly in terms of health care-seeking behaviour and frequency of testing. Interventions and behaviour changes to reduce transmission of COVID-19 have also likely had an effect on the spread of influenza and other respiratory pathogens. Testing for influenza has increased and reached populations with mild disease that previously had a low coverage of testing, primarily due to the widespread availability and use of multiplex PCR analyses for SARS-CoV-2, influenza, and RSV. The increased testing means that a higher proportion of people with an influenza infection have been included in laboratory-based reporting than previously, particularly among older children and adults under 65 years of age. In comparison with previous seasons, weekly incidence was lower than seasons before the pandemic among people aged 65 years and older, but was considerably higher among those aged 5–14 years and 15–39 years.
The spread of influenza was very low from the spring of 2020 and throughout the 2020–2021 season, both in Sweden and globally. During the summer of 2021, sporadic influenza cases were reported and the autumn of 2021 resembled the start of a regular season, with an increase in cases beginning in November. Several systems showed increasing influenza activity at levels that were normal for that time of year. The first influenza wave started in the beginning of December, and the number of cases reached its first peak in week 50. At the same time, the Omicron variant of SARS-CoV-2 was introduced to Sweden, and as the number of COVID-19 cases increased in the beginning of January, the number of influenza cases decreased drastically. The usual increase after the end-of-year holidays did not occur, and an unusually low number of influenza cases was reported during February and March. A second influenza wave started in the beginning of April, and a lower peak was reached in week 16. Influenza continued to circulate into the summer weeks and reached inter-seasonal levels in week 25 of 2022.
There were marked geographical differences in the spread of influenza during the season. In the initial wave, the middle parts of Sweden (Svealand) had higher incidence in comparison to the southern (Götaland) and the northern (Norrland) parts of the country. During the second wave, the incidence was higher in the southern (Götaland) part and the northern (Norrland) part of the country, but was overall lower than in the first wave. These trends were also seen in web search data.
During the season, 110 patients with influenza were reported as having received intensive care, which was lower than the 2016–2017 to 2019–2020 seasons, during which an average of 311 patients were reported. Of the patients in intensive care, 76 patients were admitted during the first wave of the epidemic and 34 patients during the second wave. Excess mortality was noted during week 1, 2022, which could be related to the first wave of the influenza season and to COVID-19. No excess mortality was seen in the second wave. Among patients who received a laboratory-confirmed influenza diagnosis, 2 percent died within 30 days, which was lower compared to the previous five seasons (range 3–5.5 percent). Within the season, most deaths among laboratory-confirmed cases occurred during the first wave of the season (72 percent), with the highest number of deaths occurring in week 52, 2021.
Genotypic and phenotypic characterisation was performed on viruses from a selection of influenza-positive samples collected in sentinel sampling and from influenza-positive samples sent from laboratories around Sweden. In total, 158 A(H3N2), 6 A(H1N1)pdm09, and 11 B/Victoria viruses were genetically characterised with respect to the hemagglutinin (HA) gene. The vast majority of the investigated viruses belonged to genetic groups that in antigenic analyses were poorly recognised by ferret antisera raised against the vaccine viruses included in the influenza vaccine for the northern hemisphere 2021–2022. Genotypically, no evidence of reduced susceptibility to the neuraminidase (NA) inhibitors oseltamivir or zanamivir was seen in these 175 viruses. In addition, all 11 viruses [10 A(H3N2) viruses and 1 A(H1N1)pdm09 virus] that were phenotypically analysed with respect to sensitivity to oseltamivir and zanamivir were shown to be sensitive to both substances. Analysis of the PA-gene identified no genetic markers associated with reduced sensitivity to baloxavir in any of the 167 analysed viruses [151 A(H3N2), 6 influenza A(H1N1)pdm09, and 10 B/Victoria]. The amantadine resistance mutation S31N in the matrix protein was present in all 170 analysed influenza A viruses.
The Public Health Agency of Sweden (PHAS) participates in the European Influenza Monitoring Vaccine Effectiveness (I-MOVE) network with data from the sentinel system. In the end-of-season report, the overall vaccination effect was estimated to be 75 percent for influenza A(H1N1)pdm09 (all ages) and 31 percent for influenza A(H3N2) (all ages), but the vaccination effect for influenza A(H3N2) was not significant in the age group 65 years and older (1).
During the 2021–2022 season, the average vaccination coverage among people 65 years and older was 70 percent, which was five percentage points higher than the previous season. The increase was likely due to a combination of increased interest in influenza vaccination during the pandemic and the concomitant administration of influenza vaccines with COVID-19 booster vaccines for those aged 65 years or older.
Sammanfattning
Säsongen 2021–2022 var ovanlig med två influensavågor och en mellanperiod med mycket låg aktivitet. Denna period sammanföll med den intensiva smittspridningen av omikronvarianten av covid-19. Subtypning av prover från såväl sentinelprovtagningen och laboratorierapporteringen visade en kraftig dominans av A(H3) under säsongen. Den sammantagna bedömningen är att säsongens första våg var medelhög i intensitet medan den andra vågen var av låg intensitet. Totalt rapporterades drygt 13 000 fall under säsongen 2021–2022.
Såväl spridningen som övervakningen av säsongsinfluensa har påverkats av covidpandemin sedan mars 2020, särskilt när det gäller vårdsökande beteende och testfrekvens. Åtgärder och beteendeförändringar för att minska smittspridningen av covid-19 har sannolikt också haft en effekt på spridningen av influensa och andra luftvägsinfektioner. Provtagningen för influensa har ökat och många prover analyseras samtidigt för influensa, RSV och SARS-CoV-2 genom multiplex PCR, och nått populationer med mildare sjukdom som tidigare haft en lägre provtagning. Den ökade provtagningen innebär att en högre andel personer med en influensainfektion har ingått i laboratorierapporteringen än tidigare, särskilt bland äldre barn och vuxna under 65 år. Jämfört med tidigare säsonger var incidensen per vecka lägre bland personer 65 år och äldre lägre medan antalet fall per vecka i åldersgrupperna 5–14 år och 15–39 år var betydligt högre.
Spridningen av influensavirus var mycket låg från våren 2020 och under hela föregående säsong (2020–2021) både i Sverige och i övriga världen. Under sommaren 2021 rapporterades sporadiska fall och hösten liknade inledningen av en vanlig säsong, med ett ökat antal rapporterade fall under november. Flera system visade på en ökande influensaaktivitet som var normal för årstiden. En första epidemistart inträffade i början av december och antalet fall ökade till en topp under vecka 50. Samtidigt introducerades omikronvarianten av covid-19 till Sverige, och när fallen av covid-19 ökade kraftigt i början av januari minskade influensafallen snabbt. Den ökning som brukar ses efter årsskiftet uteblev och ovanligt få influensafall rapporterades perioden februari till mars. I början av april rapporterades sedan ett ökat antal fall och en andra våg sågs med en topp vecka 16. Spridningen av influensa fortsatte in på sommaren och nådde mycket låg nivå vecka 25 2022.
Det har varit tydliga geografiska skillnader i spridningen av influensa under säsongen. Under den första vågen kring årsskiftet var det högre incidens i Svealand, jämfört med Götaland och Norrland. Under den andra vågen var incidensen högre i Götaland och Norrland, men sammantaget lägre än första vågen. Dessa trender återspeglades i data från Webbsök för influensa.
Under säsongen rapporterades 110 patienter som intensivvårdade med influensa nationellt, vilket är lägre jämfört med i genomsnitt 311 patienter säsongerna 2016–2017 till 2019–2020. Totalt vårdades 76 patienter på intensivvårdsavdelning under första vågen och 34 under andra vågen. Överdödligheten bland personer 65 år och äldre var strax ovanför normalspannet för årstiden under vecka 1, vilket kan relateras till den första influensavågen och till covid-19. Under den andra influensavågen sågs en dödlighet inom normalspannet för årstiden. Bland personer som fått en laboratoriebekräftad influensadiagnos hade 2 procent avlidit inom 30 dagar, vilket är lägre än föregående fem säsonger (3–5,5 procent). Under säsongen inträffade de flresta dödsfallen bland bekräftade fall under första influensavågen (72 procent), med det högsta veckovisa antalet dödsfall vecka 52 2021.
Genotypisk och fenotypisk karaktärisering har utförts på influensastammar från ett urval de influensapositiva prover som samlats in genom sentinelprovtagningen samt de som skickats till Folkhälsomyndigheten från svenska laboratorier. Totalt har 158 A(H3N2)-, 6 A(H1N1)pdm09- och 11 B/Victoria-stammar karaktäriserats avseende genetisk grupptillhörighet baserat på hemagglutinin (HA)-genen. De flesta av dessa stammar visade sig tillhöra genetiska grupper som i antigeniska analyser har uppvisat nedsatt reaktivitet mot illerantisera genererat efter immunisering med de respektive vaccinstammar som ingår i influensavaccinet för norra halvklotet 2021-2022. Ingen minskad känslighet för neuraminidashämmarna oseltamivir (Tamiflu®/Ebilfumin®) eller zanamivir (Relenza®) påvisades vid genotypisk analys av neuraminidas (NA)-genen hos de 175 proverna. Ej heller har någon minskad känslighet påvisats hos någon av de 11 stammar [10 A(H3N2), och en A(H1N1)pdm09] som hittills genomgått fenotypisk analys av känslighet för oseltamivir och zanamivir. Ingen genetisk markör associerad med minskad känslighet för baloxavir har identifierats bland de 167 stammar [151 A(H3N2), 6 influensa A(H1N1)pdm09, och 10 B/Victoria] där PA-genen har sekvenserats. Samtliga av 170 analyserade influensa A-stammarna bar på mutation S31N i matrixproteinet vilken ger upphov till resistens mot amantadin.
Folkhälsomyndigheten deltar i det europeiska nätverket för att mäta influensavaccinets effekt I-MOVE med data från den svenska sentinelprovtagningen. Vid säsongsrapporten för 2021–2022 beräknades en vaccinationseffekt på 75 procent för influensa A(H1N1)pdm09 (alla åldrar) och 31 procent för influensa A(H3N2) (alla åldrar), dock sågs ingen vaccinationseffekt mot A(H3N2) i åldersgruppen 65 år och äldre (1).
Under säsongen var vaccinationstäckningen bland personer 65 år och äldre i medel 70 procent nationellt, vilket är fem procentenheter högre än föregående säsong. Den ökade vaccinationstäckningen är sannolikt en kombination av ökad efterfrågan under pandemin och möjligheten till samtidig influensavaccination och vaccination med påfyllnadsdos mot covid-19 i åldersgruppen 65 år och äldre.
About this publication
This report describes the monitoring systems for influenza in use during the 2021–2022 winter season and the results of both epidemiological and virological surveillance. Data are also compared to previous influenza seasons.
The report has been prepared for the World Health Organization (WHO) as part of the Public Health Agency of Sweden’s function as a National Influenza Centre (NIC).
Annual reports in English about the influenza seasons in Sweden have been available since 1997, and those from 2000–2001 onward can be found on the Public Health Agency’s website (suggested search “Influenza in Sweden”) (2).
Public Health Agency of Sweden
Lena Dillner
Head of Unit
Unit for Laboratory Surveillance of Viral Pathogens and Vaccine Preventable Diseases
Anneli Carlander
Head of Unit
Unit for Coordination and Surveillance COVID-19
Influenza surveillance in Sweden
Influenza epidemics recur in Sweden during winter, with a range of effects depending on the characteristics of the circulating viruses and the level of immunity in different age groups. In order to get an overall picture of on-going influenza activity and to remain prepared in case of a pandemic, the Public Health Agency of Sweden (Folkhälsomyndigheten) (PHAS) has a number of different epidemiological reporting systems for influenza ranging from the collection of data from different healthcare providers to the analysis of web searches.
Virological surveillance provides additional data on occurrence and detailed information on typing and resistance in circulating strains. Viruses are typed as influenza A or B by regional laboratories in real time during the influenza season, and some laboratories also determine the subtype for influenza A. Throughout the season, viruses from around the country are characterised at the PHAS laboratory with regard to subtype and lineage, vaccine similarity, and sensitivity to antiviral drugs. Viruses are also isolated and sent to the WHO Collaborating Centre (WHOCC) in London for further characterisation and to provide a basis for vaccine strain selection. When new strains of influenza virus emerge, reference methods for diagnostics are established at the PHAS and shared with all microbiological laboratories in Sweden.
During the influenza season, the PHAS condenses national and international data into a detailed weekly bulletin that is published on the agency’s website (3). A preliminary summary of the 2021–2022 season was published on July 20, 2022 (4). The bulletin provides timely analysis of the current situation in Sweden and abroad and has a wide readership.
Updates to national policies and recommendations
During the 2021–2022 season, updated web-based information about vaccinations and influenza were published continuously throughout the season. In addition, updated recommendations about influenza vaccination of risk groups were published in October 2021 (5).
Current recommendations for influenza vaccination of risk groups (in Swedish)
Surveillance 2021–2022
The surveillance pyramid below illustrates the different outcomes and levels of severity and the corresponding surveillance systems for individuals infected with influenza (Figure 1), ranging from the large number of infected individuals to the small number who die as a result of the influenza infection. Table 1 describes the data collection systems that the PHAS used to monitor influenza activity at the various levels of the pyramid in Sweden during the 2021–2022 season and shows a summary of the results of each system. Each system is described further at the start of each section below showing the season’s results in detail. The COVID-19 pandemic had a significant impact on influenza surveillance during the season, with changes to healthcare seeking and testing behaviour and increased calls to medical advice lines. Integration of influenza and COVID-19 surveillance is ongoing.
Table 2 shows at which week each system, as applicable, crossed the threshold for epidemic start and when it reached its peak notation in the first and second wave, as well as the maximum intensity level measured by the system during the season.
Figure 1. The surveillance pyramid showing possible outcomes of an influenza infection and the surveillance systems at each level.
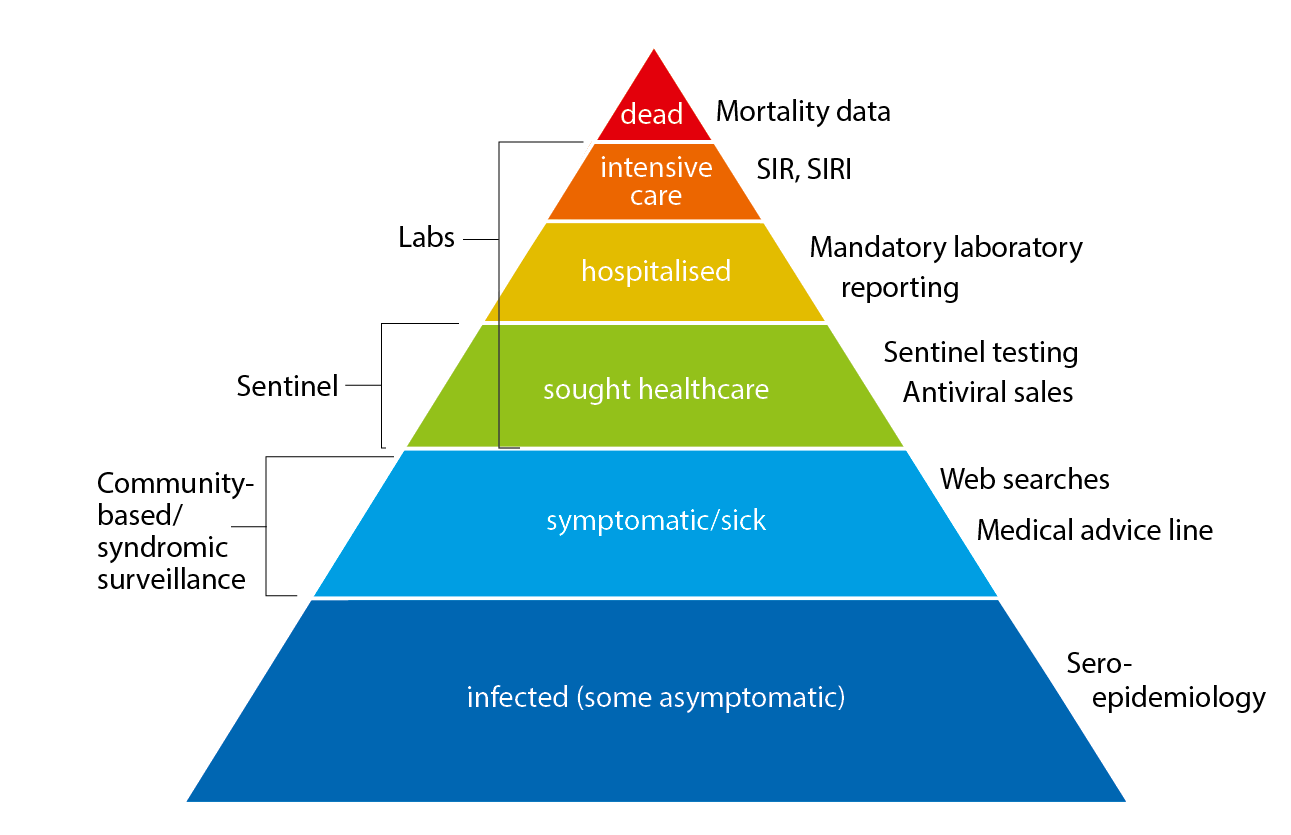
SIR: Swedish Intensive Care Registry
SIRI: Swedish Intensive Care Registry – Influenza module
| Reporting system/method | Implementation | What does the system/method show? | Results (2021–2022) | |
|---|---|---|---|---|
| Statutory laboratory reporting of influenza including sub-/lineage typing results, if available. | Legal obligation for all laboratories to report influenza diagnoses along with full patient identity in the web-based reporting system, SmiNet, in accordance with the Communicable Diseases Act. | Number of laboratory-confirmed cases of influenza A and B together with age, gender, and geographical distribution. Influenza virus and sub-/lineage type distribution. | 13,150 laboratory-confirmed cases of influenza A and 137 cases of influenza B. In total, 99% influenza A and 1% influenza B. Of influenza A cases subtyped, 1% A(H1)pdm09 and 99% A(H32). Of influenza B cases with determined lineage, of which 0% B/Yamagata and 100% B/Victoria. | |
| Voluntary reporting of denominator data | Voluntary reporting of number of samples tested sent via email. | Proportion of samples tested that are positive | 425,423 samples tested with 3% positive. | |
| Antiviral sales | Weekly data from the Swedish eHealth Agency | Number of packages sold by type of sale, including prescriptions and health care requisitions. | 7,023 packages | |
| Voluntary clinical reporting of laboratory-confirmed influenza cases (all types) in intensive care (SIRI) | Collaboration with the Swedish Intensive Care Registry (SIR). Treating physicians in intensive care units voluntarily report clinical information about patients with laboratory-confirmed influenza. | Severity of infections by different influenza subtypes and impact on the intensive care units. | 110 laboratory-confirmed cases of influenza were reported from SIRI. Of those, 94 were reported as influenza A (unknown subtype) and 16 were A(H3). | |
| Excess mortality | Weekly data on the aggregated number of deaths in Sweden, by age group, is sent from the Swedish Tax Agency to the Public Health Agency and analysed with a statistical model. | All-cause mortality (EuroMoMo model) | Excess mortality was seen in weeks 1, 4, and 5 (2022) | |
| Deaths within 30 days | Weekly data on date of death are sent from the Swedish Tax Agency to the Public Health Agency and analysed intermittently. | Death within 30 days of influenza diagnosis | 272 of 12,973 persons with a laboratory-confirmed influenza diagnosis died within 30 days of diagnosis, of which 97% were influenza A. Most (90%) were aged 65 years and older. | |
| Sentinel sampling | Samples from some patients who present with influenza-like illness (ILI), as well as some patients with acute respiratory illness (ARI), are analysed by the Public Health Agency for influenza. | The proportion of sentinel patients with ILI or ARI who have an influenza infection (see also virus characterisation below). | 376 samples were analysed, of which 52 (14%) tested positive for influenza. Of these, 0% A(H1)pdm09, 81% A(H3), 0% B/Victoria, 0% B/Yamagata, and 19% A not subtyped (low viral load). In total, 90% of the patients had clinical symptom of ILI. |
|
| Genotypic and phenotypic characterisation | Continual genotypic and phenotypic analysis of a selection of influenza-positive laboratory and sentinel samples. | Genetic affiliation, genetic vaccine similarity, and susceptibility to antiviral drugs among the viruses selected for characterisation. | The vast majority of the 175 analysed viruses were shown to belong to other genetic groups than those affiliated to the viruses included in the northern hemisphere vaccines 2021–2022. Genotypically, no viruses with reduced sensitivity to oseltamivir or zanamivir (175 analysed viruses) or to baloxavir (167 analysed viruses) were identified. Phenotypically, all 11 viruses analysed so far (by the WHOCC London) were sensitive to both oseltamivir and zanamivir. The amino acid substitution S31N conferring resistance to amantadine was identified in all 170 analysed influenza A viruses. | |
| Vaccination coverage | Periodic collection of coverage data from county councils. | Vaccination coverage per age group. | 70% coverage among those 65 years or older | |
| Webbsök (Web Search) | An automated system that uses search data from the national medical advice site 1177.se. The numbers of searches for influenza and influenza symptoms are entered into a statistical model that estimates the proportion of patients with ILI visiting general practitioners. | Estimates the proportion of patients with ILI. | Between week 27, 2021, and week 26, 2022, a total of 287,742 queries related to influenza were entered, which was 3% of the total number of queries on the website 1177.se. | |
| Telephone Advice Line (1177 Vårdguiden) | Weekly aggregated data on the primary reason for contacting the medical advice line (phone number 1177) and the age group of the person concerned are manually reported to the Public Health Agency through the system Hälsoläge. Data are collected from 18 of Sweden’s 21 county councils (Stockholm, Sörmland, and Värmland are excluded because of data irregularities). | Primary reason for calling by age group (adults and children). | Approximately 75,821 calls regarding fever in children during the season. Fever in children accounted for 6.6 % of all calls to 1177. During the peak weeks (weeks 3-4, 2022), 8.6% of calls were due to fever in children. | |
| System | Start | Peak 1 | Peak 2 | Max intensity |
|---|---|---|---|---|
| Laboratory-based surveillance (number of cases) | 48 | 50 | 16 | Medium (peak 1), low (peak 2) |
| Laboratory-based surveillance (% positive) | 48 | 50 | 16 | (a) |
| Antiviral sales | (a) | 49-1 | 15-19 | (a) |
| Laboratory-confirmed influenza cases in intensive care (SIRI) | (a) | 51-52 | 16 | (a) |
| Excess mortality | (a) | 1 (4-5) | none | (a) |
| Sentinel sampling | (a) | 50 | (b) | (a) |
| Webbsök (Web Search) | 42 | 51 | none | Low |
| Telephone Advice Line (1177 Vårdguiden) | 39 | 51 (3-4) | 15-16, 18-20 | Medium |
(a) Epidemic thresholds/intensity levels not assigned. (b) Insufficient samples in second wave.
Laboratory-based surveillance
Testing for influenza
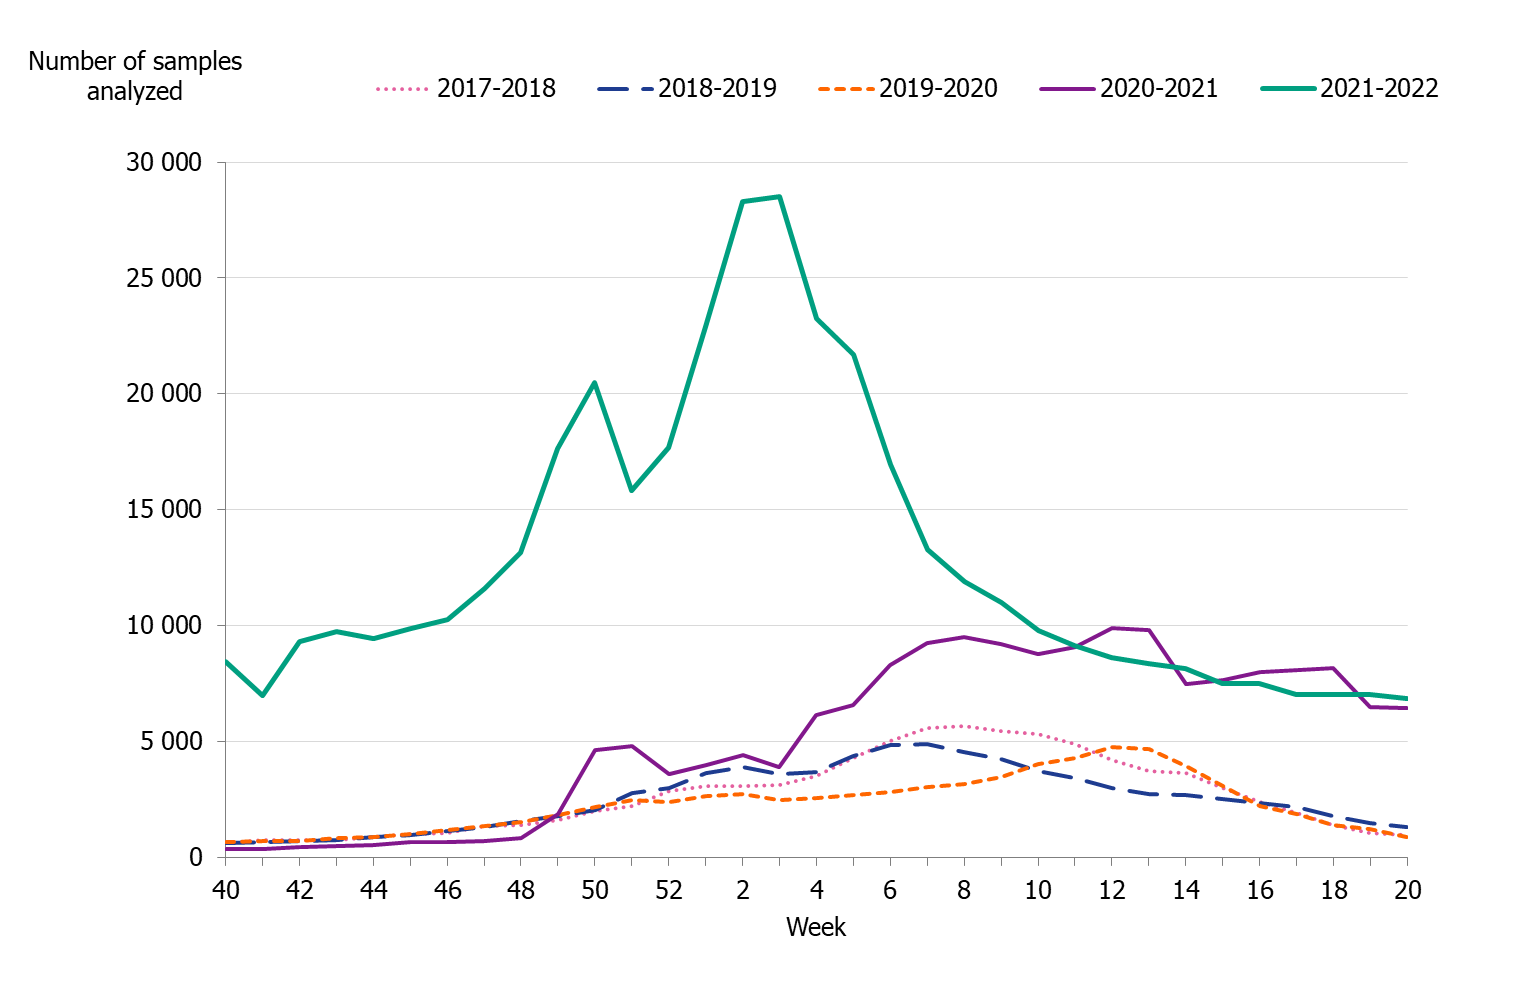
Testing for influenza in Sweden is performed with molecular methods, predominately PCR-based tests. All laboratory-confirmed cases of influenza are reported to the PHAS by the clinical microbiology laboratories. Laboratory reporting of positive cases is mandatory according to the Communicable Disease Act. Denominator data (the total number of samples analysed) are reported voluntarily by the laboratories. As less expensive and faster systems for influenza testing have become available, testing has expanded from mainly hospital settings to also include outpatient care, including primary care to some extent. The COVID-19 pandemic has impacted the patterns of testing of influenza in Sweden. The introduction of combined tests for SARS-CoV-2, influenza, and RSV has led to a surge in performed influenza analyses and to a different demography of tested individuals. At most, approximately 28,000 samples were analysed per week in weeks 2-3, 2022, corresponding to the peak weeks of the first Omicron wave in Sweden, see Figure 2. The number of samples analysed per week was significantly higher during the 2021–2022 season than the seasons preceding the pandemic, see Figure 3.
Since the testing has increased, a greater proportion of people with an influenza infection have been diagnosed, and thus have been included in laboratory-based reporting, than previously. More people with milder symptoms have been tested than during previous seasons, and testing has been higher than usual particularly among older children and adults under 65 years of age (based on analyses of RSV-denominator data, not shown). In turn, more laboratory-confirmed cases have been reported among these age groups than in previous seasons, see also Age and sex distribution of cases.
Figure 2. Number of samples analysed for influenza and the proportion of positive samples, season 2021–2022.
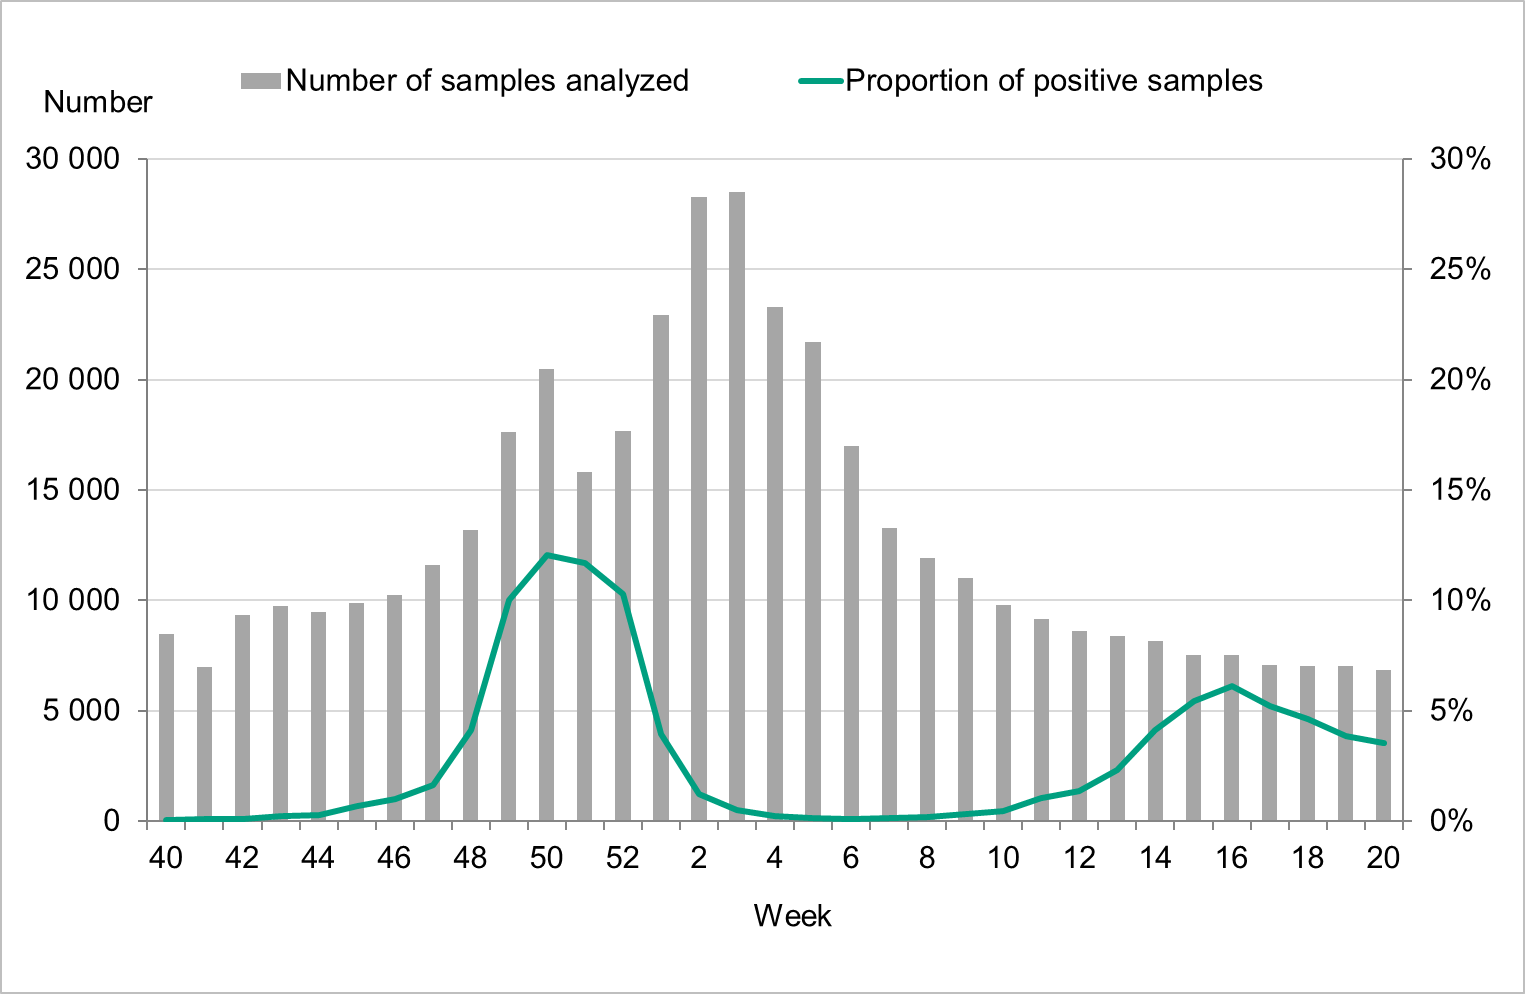
Figure 3. Number of samples analysed for influenza data per week, per season, 2017–2022.
Laboratory-confirmed influenza cases
The 2021–2022 influenza season was unusual with two epidemic waves separated by very low influenza activity. The first wave of the epidemic started in the beginning of December, week 48, and the number of cases reached the first peak in week 50, during which 2,500 cases were reported (Figure 4). In the beginning of January, as the number of cases of COVID-19 increased, the number of influenza cases decreased drastically. An unusually low number of influenza cases were reported during February and March. A second influenza wave started in the beginning of April, and a second, smaller peak was reached in week 16, during which 450 cases were reported.
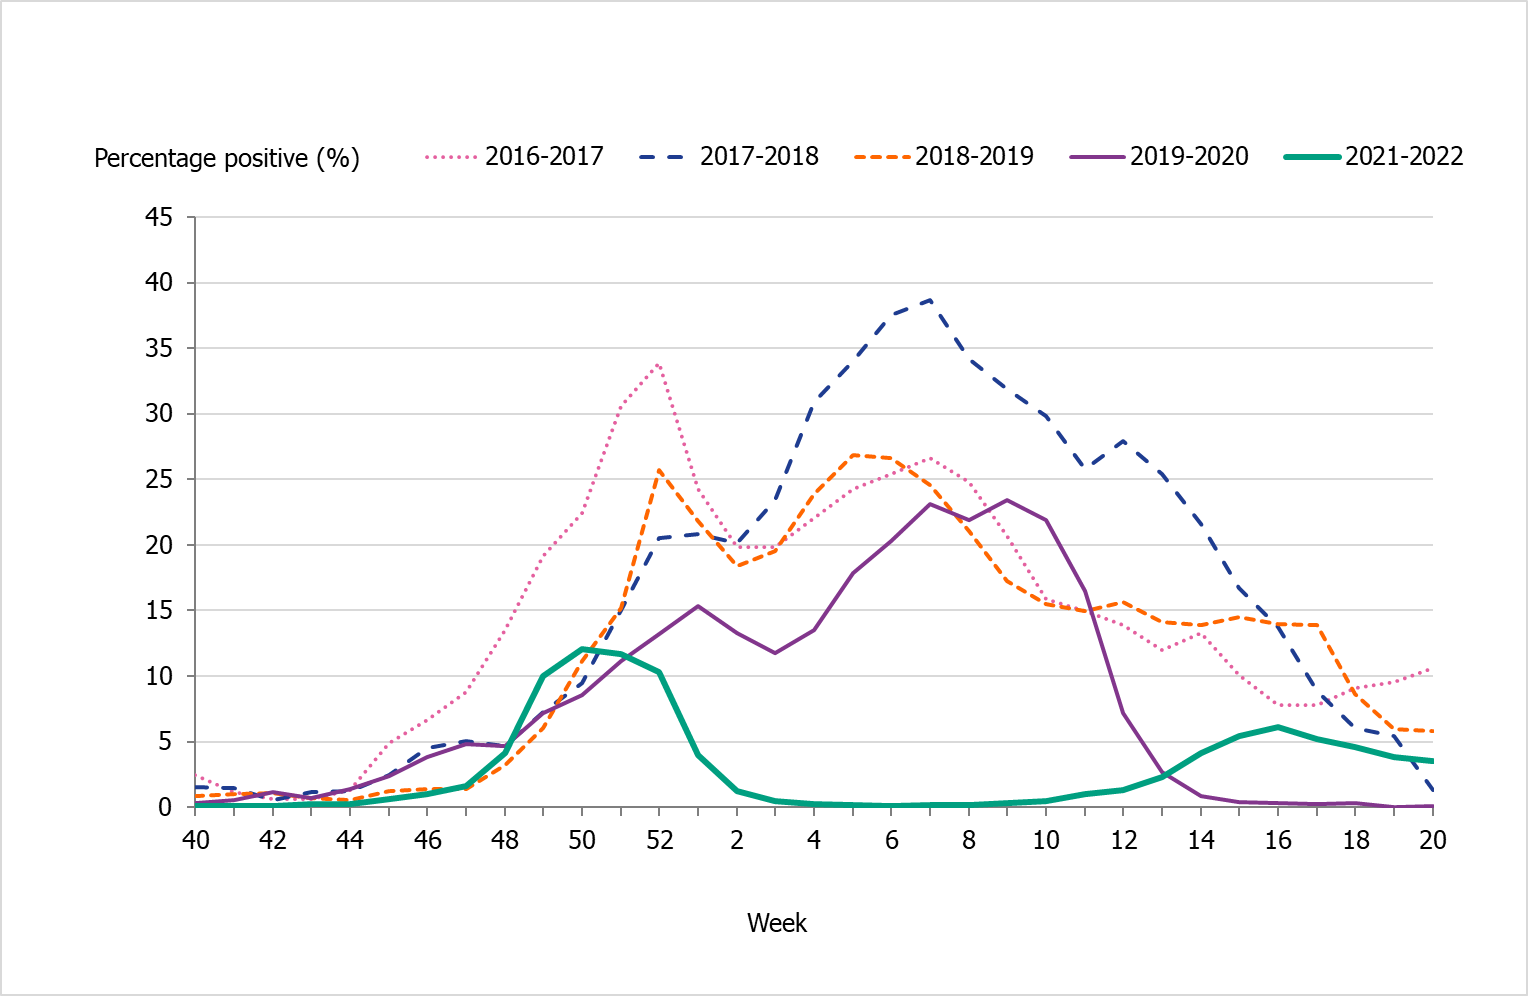
The two peaks of the season were also seen in the percentage of positive cases (Figure 5). The first peak at 15 percent positive was seen in week 50, followed by a second peak in week 16 at 6 percent positive. During the intervening period of low activity from week 2 until week 13, 1 percent or lower of samples were positive for influenza.
Nearly all of the cases (>99 percent) during the first peak (week 50) were influenza A, and influenza A(H3N2) was the dominating subtype during the season. See also Subtyping and lineage determination.
In comparison with recent seasons, the number of reported laboratory-confirmed influenza cases during the current season (13,287) was similar to the number of reported cases in seasons 2016–2017 and 2018–2019, see Table 3. However, the lower percentage of positive samples this season in combination with the increased testing shows that despite the similarity of the number of reported cases the current season was milder. During the two peak weeks (week 50 and 16), the percentage of positive samples was lower than recent season peaks (Figure 5). Overall, 3 percent of the samples taken were positive for influenza, which was lower compared to previous seasons, except for 2020–2021, reflecting the high levels of testing compared with previous seasons and the low to medium intensity of the epidemic (Table 3).
Figure 4. Total number of laboratory-confirmed cases of influenza (all types) per week and the dominating influenza type(s) per season, 2016–2017 to 2021–2022 (a).
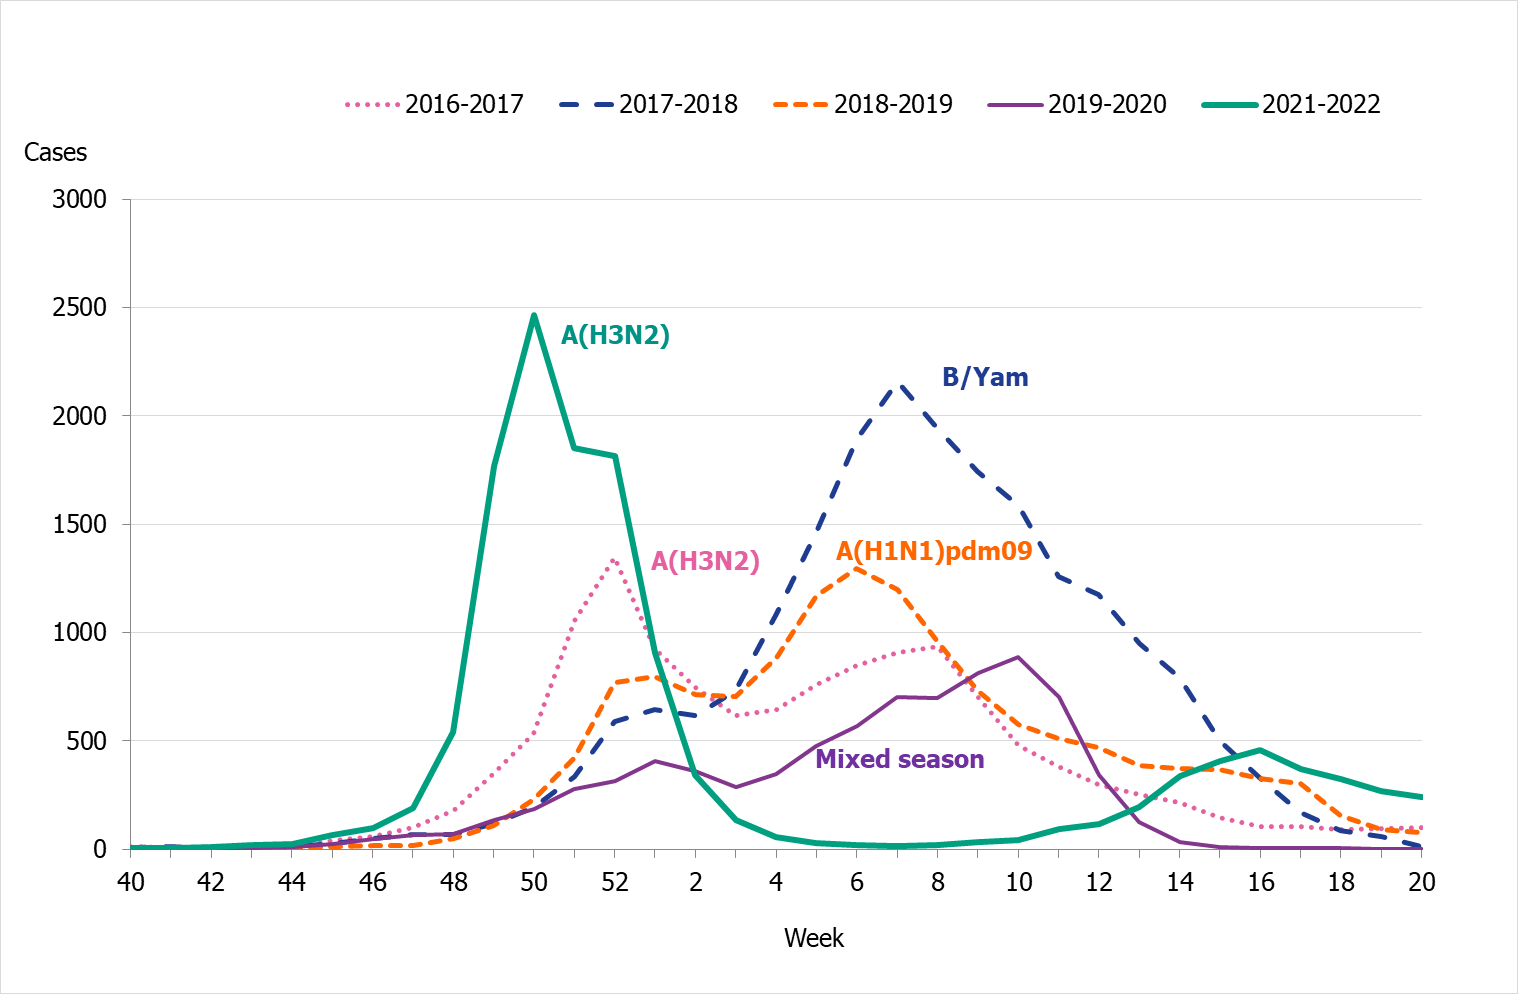
(a) Season 2020–2021 is not included due to the small number of cases.
Figure 5. Percentage of samples testing positive for influenza, per week, 2016–2017 to 2021–2022 (a).
(a) Season 2020–2021 is not included due to the small number of cases.
Viral distribution
During the 2021–2022 season, 13,287 laboratory-confirmed cases were reported, of which nearly all were influenza A (99 percent). Table 3 summarises the laboratory reporting results over the last five seasons, including the number of analysed samples and the proportion of positive samples as well as the total number of positive samples by type.
| Indicator | 2016-2017 | 2017–2018 | 2018–2019 | 2019–2020 | 2020-2021 | 2021-2022 |
|---|---|---|---|---|---|---|
| Analysed samples | 68,241 | 88,837 | 83,325 | 75,819 | 175,048 | 425,423 |
| Proportion positive samples | 19% | 23% | 17% | 11% | 0,02% | 3% |
| Total positive for influenza A | 12,359 | 7,406 | 13,664 | 5,441 | 10 | 13,150 |
| Total positive for influenza B | 707 | 13,280 | 93 | 2,500 | 19 | 137 |
Age and sex distribution
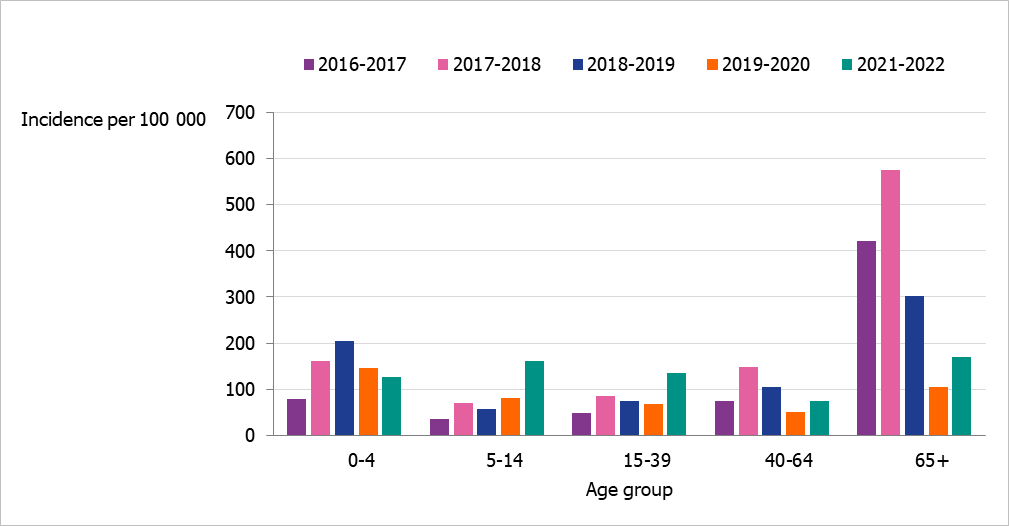
During the 2021–2022 season, more cases were seen among children 5 to 14 years and persons 15-39 years than previous seasons because these groups were tested to a much greater extent than previously. The highest proportions of cases (34 percent) of laboratory-confirmed influenza A and B were seen among individuals aged 15–39 years followed by persons aged 65 years and older (27 percent).
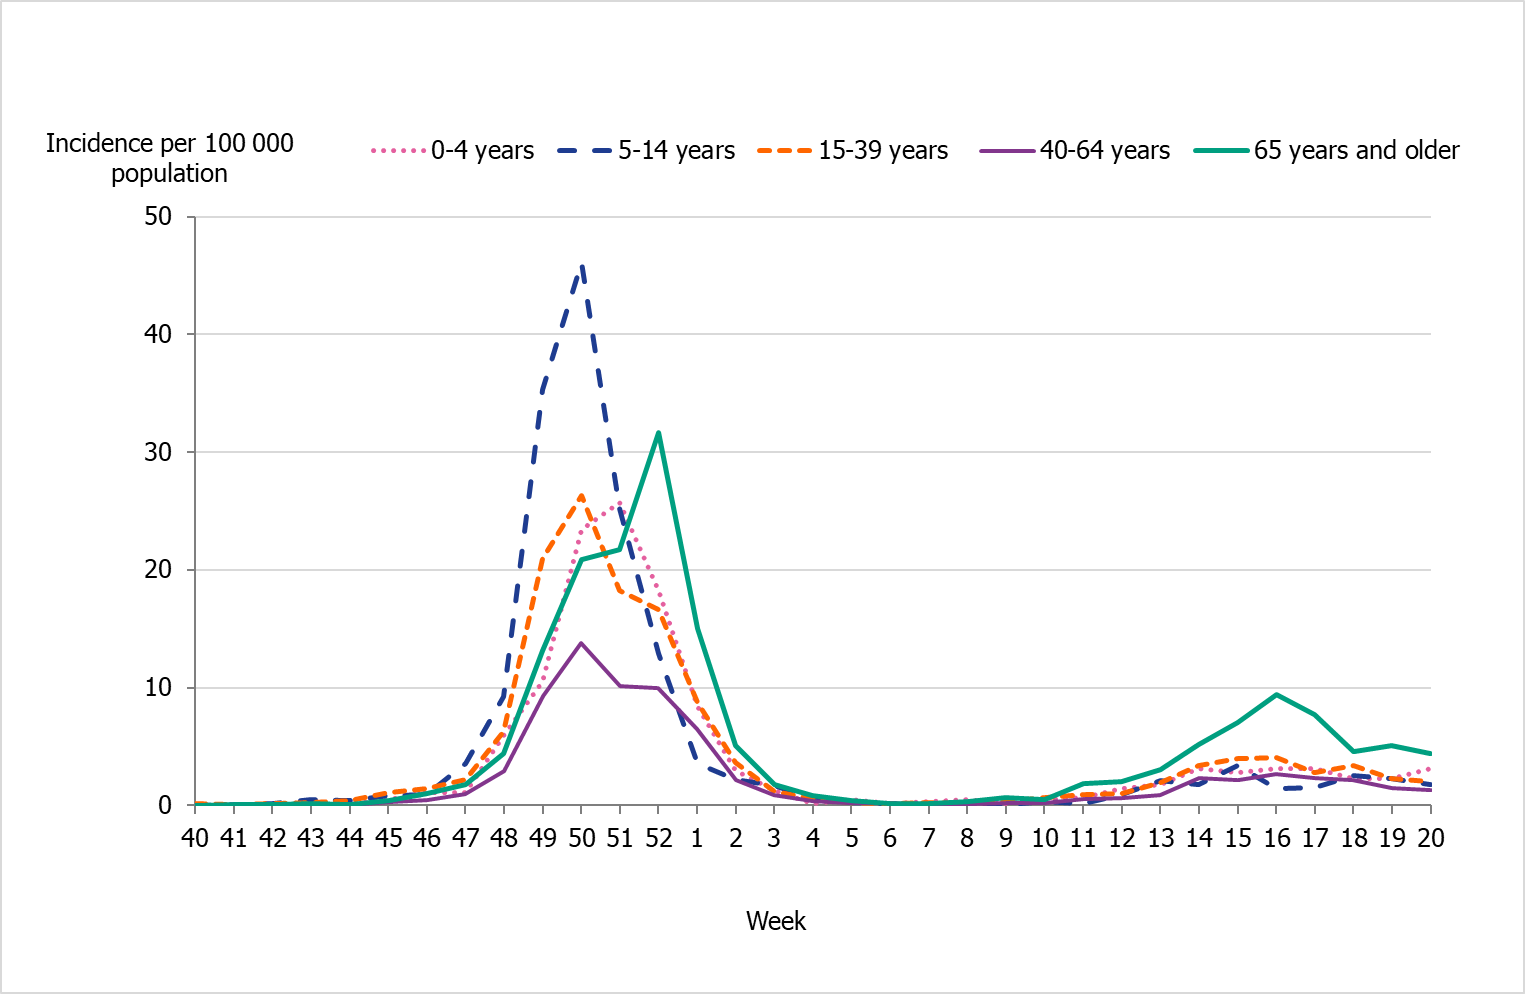
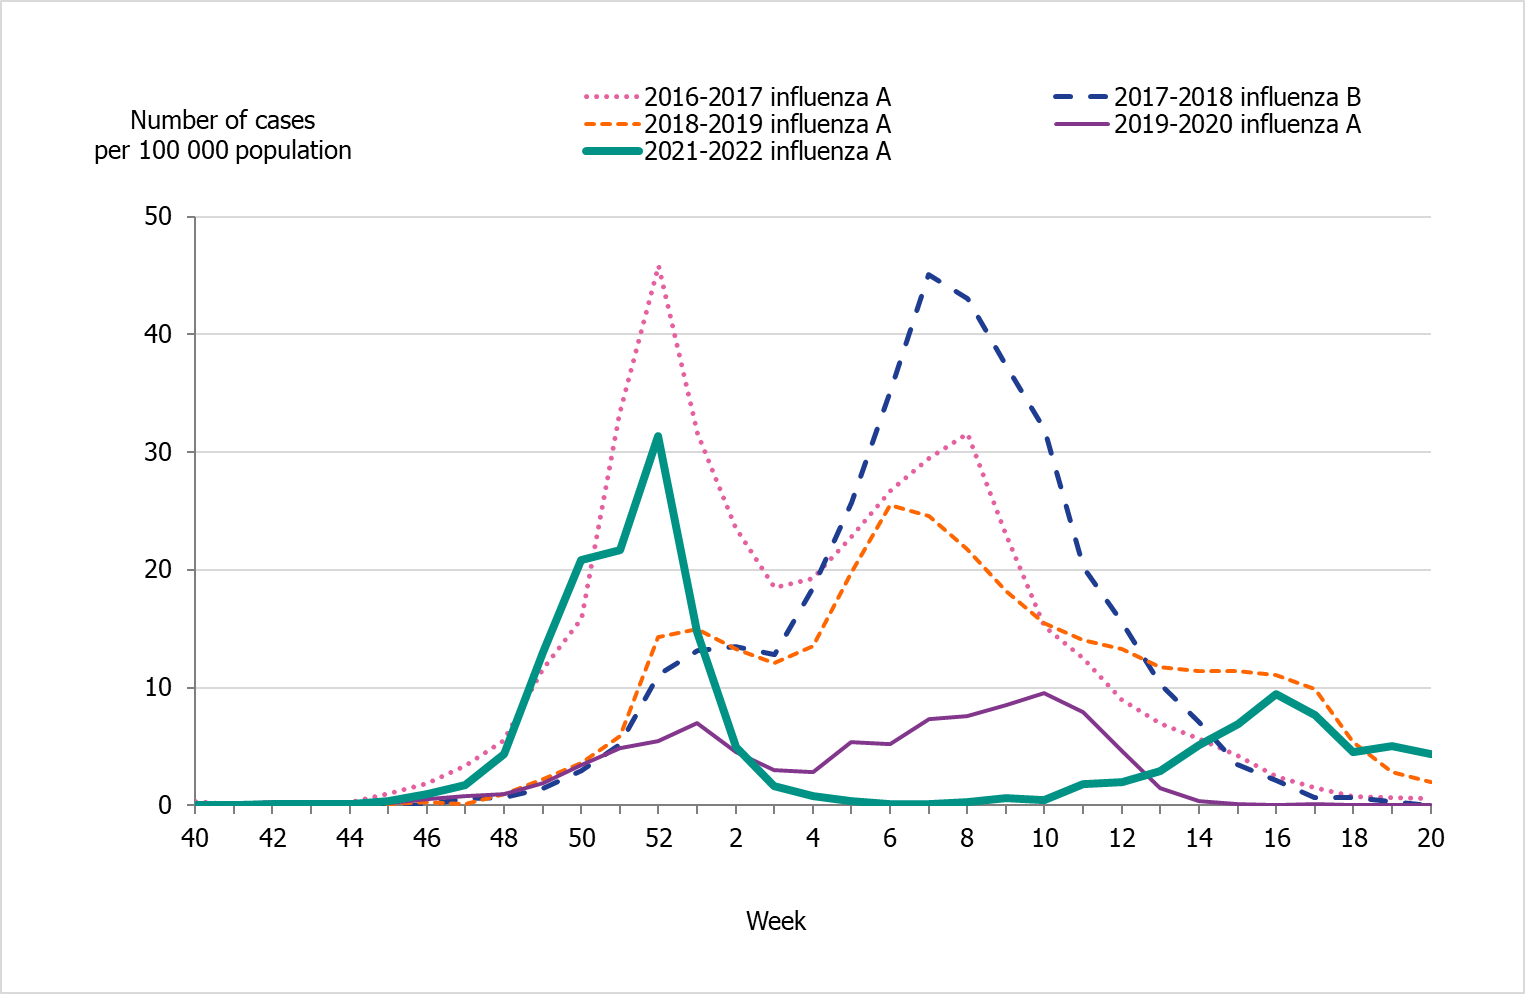
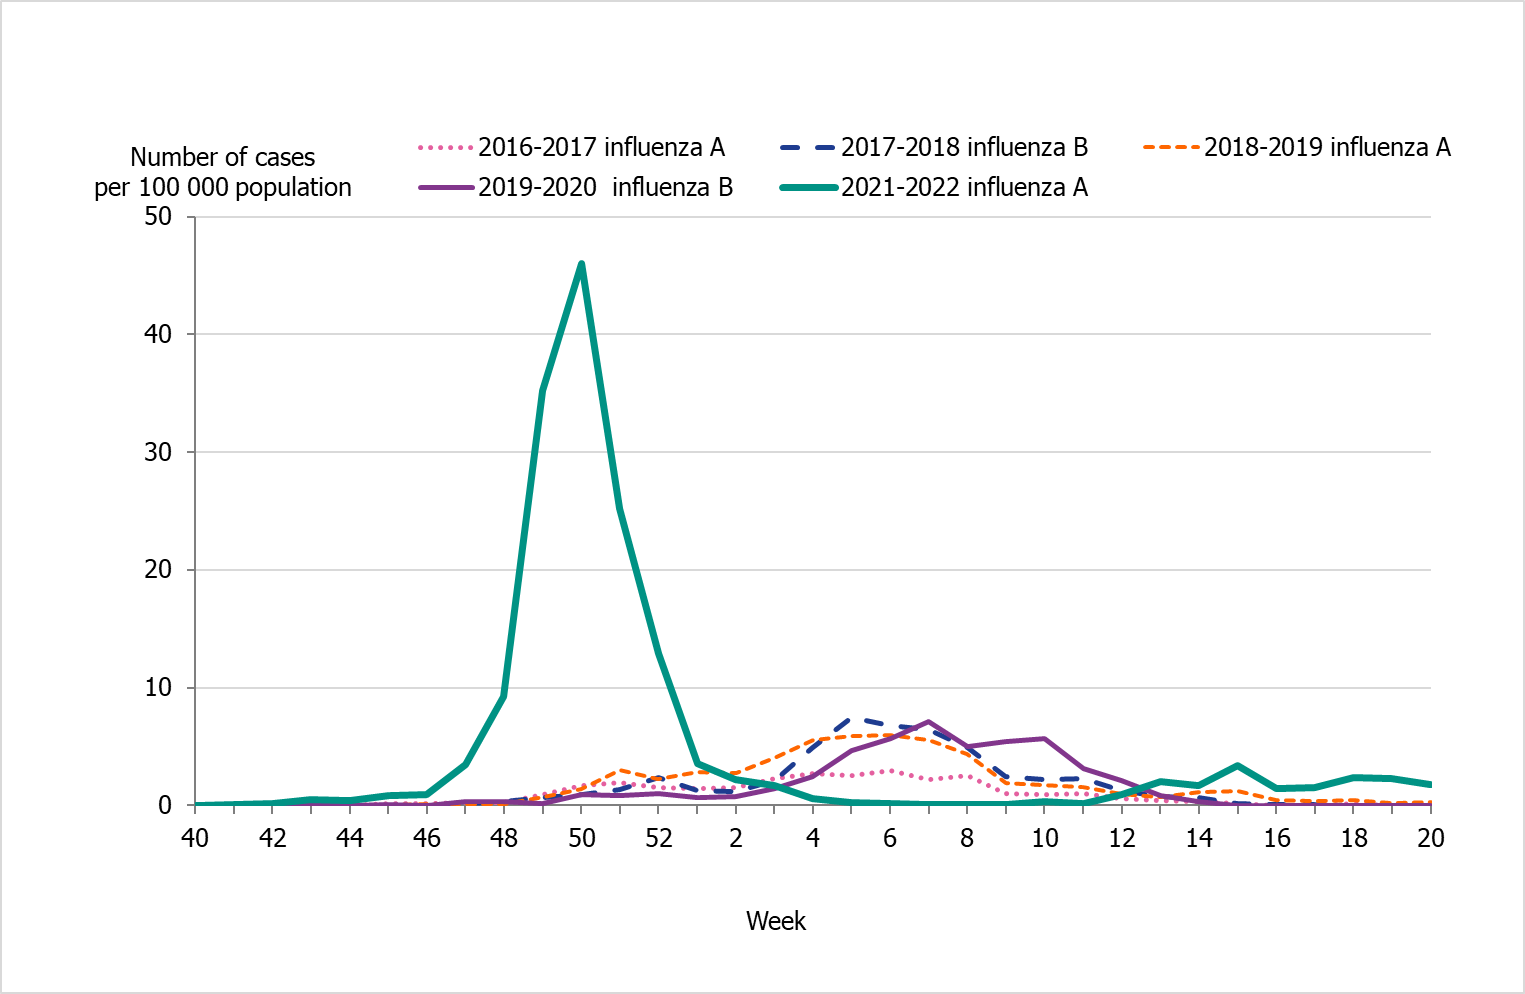
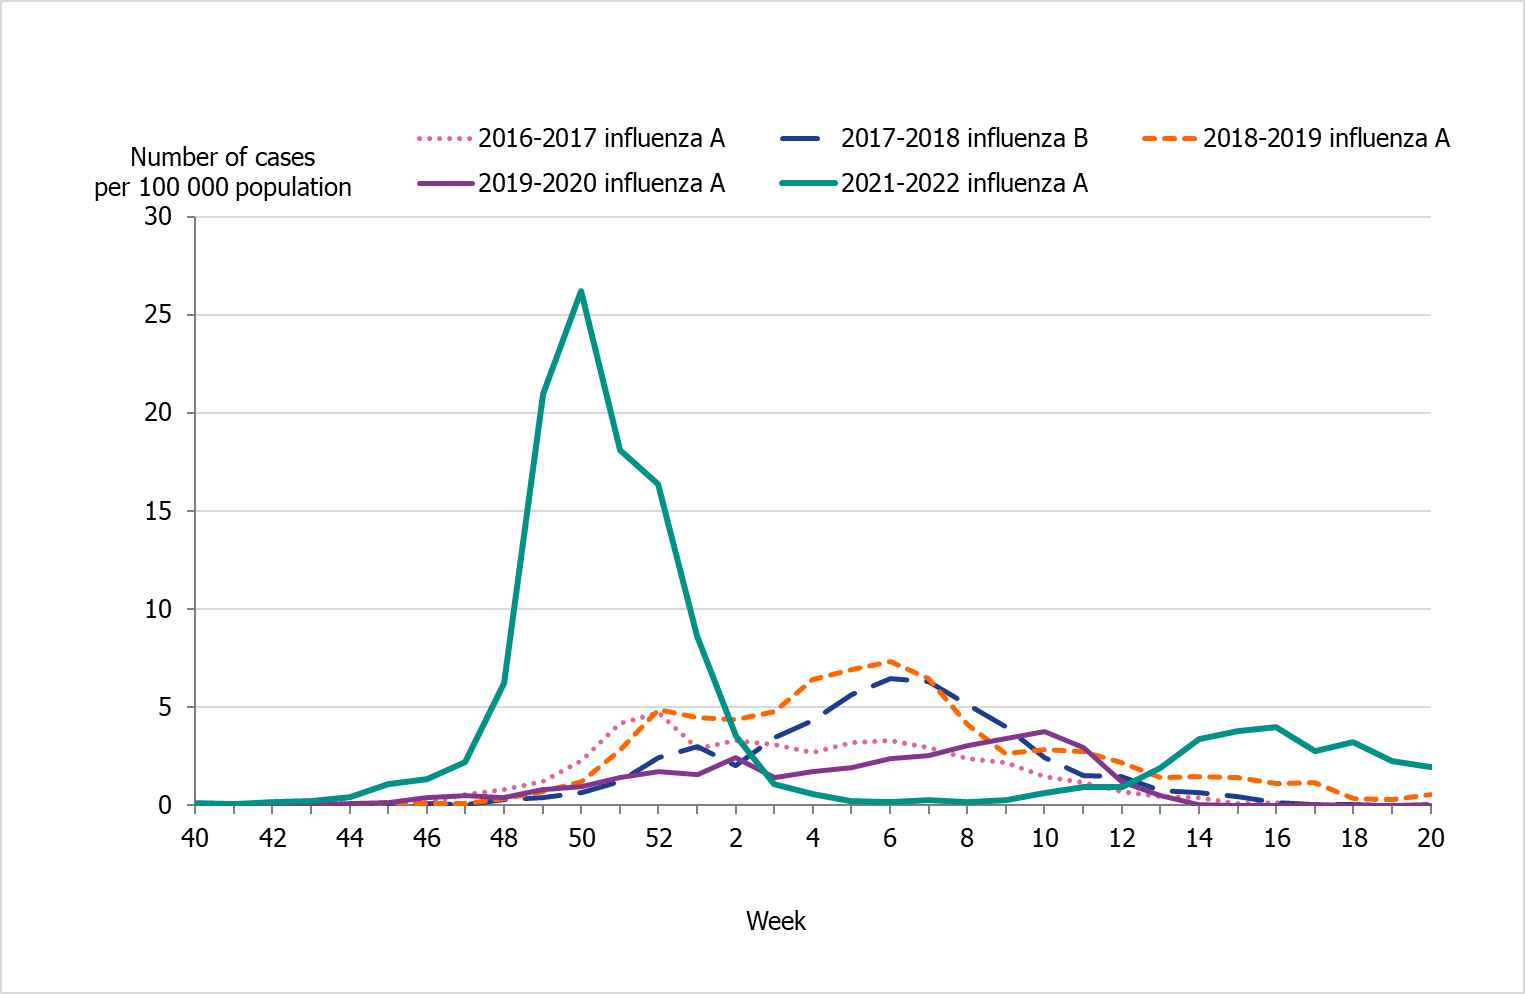
People aged 65 years and older had the highest cumulative incidence (171 per 100,000 population) followed by children aged 5 to 14 years (162 per 100,000 population) (Figure 6, see also Table 4). Children aged 5–14 years had the highest weekly incidence, peaking in week 50 followed by persons aged 65 years and older in week 52 (Figure 7). Compared to the four previous season, the incidence of the dominant type of influenza for those aged 65 and older was lower compared to seasons 2016–2017 and 2017–2018 during which influenza A(H3N2) and B/Yamagata circulated, respectively (Figure 8). The peak in weekly incidence amongst children aged 5–14 years and people aged 15–39 years was strikingly higher compared to the four previous seasons (Figure 9 and 10). Changes in the testing during the season due to the COVID-19 pandemic probably influenced the high incidence among children. Older children who previously would not get tested for influenza as often were tested more this season. The median age of individuals with laboratory-confirmed influenza A (35 years) also reflects the increase in younger individuals who were diagnosed with influenza (Table 5).
Significantly more women (55 percent) than men (45 percent) had laboratory-confirmed influenza (p < 0.001), which likely reflects a slightly higher testing rate among women than men. Data from a selection of laboratories indicate that more women than men were tested during the season (not shown).
The majority of the influenza B laboratory-confirmed cases were seen among individuals aged 15–39 years (38 percent), followed by persons aged 65 years and older (29 percent) (Table 4). The median age for influenza B was 39 years (Table 5).
Figure 6. Incidence (per 100,000 population) of laboratory-confirmed influenza cases per age group, Sweden, 2016–2022 seasons (a).
(a) Season 2020–2021 is not included due to a small number of cases.
Figure 7. Weekly incidence of influenza A and B per age group in Sweden, 2021–2022 season.
| Age group | Population (b) | Influenza ACases | Influenza AIncidence | Influenza B Cases | Influenza B Incidence | Incidence(all influenza) |
|---|---|---|---|---|---|---|
| 0–4 | 571 352 | 712 | 125 | 11 | 2 | 127 |
| 5–14 | 1,249,731 | 2,016 | 161 | 7 | 1 | 162 |
| 15–39 | 3,294,043 | 4,434 | 135 | 52 | 2 | 136 |
| 40–64 | 3,194,973 | 2,381 | 75 | 27 | 1 | 75 |
| 65–69 | 541,072 | 458 | 85 | 2 | 0 | 85 |
| 70–74 | 537,540 | 605 | 113 | 10 | 2 | 114 |
| 75–79 | 485,123 | 727 | 150 | 12 | 2 | 152 |
| 80–84 | 293,721 | 687 | 234 | 7 | 2 | 236 |
| 85–89 | 170,242 | 576 | 338 | 5 | 3 | 341 |
| 90–94 | 80,334 | 393 | 489 | 2 | 2 | 492 |
| ≥95 | 24,969 | 154 | 617 | 2 | 8 | 625 |
| Total | 10,443,100 | 13,143 | 126 | 137 | 1 | 127 |
(a) The table does not include sentinel cases or cases where age is unknown.
(b) Population on December 31, 2021. Source: Statistics Sweden, Statistikdatabasen.
Figure 8. Weekly incidence of influenza (dominating type) for individuals aged 65 and older in Sweden, 2016–2022 seasons (a).
(a) Season 2020–2021 is not included due to the smallnumber of cases.
Figure 9. Weekly incidence of influenza (dominating type) for children aged 5–14 years in Sweden, 2016–2022 seasons (a).
(a) Season 2020–2021 is not included due to the small number of cases.
Figure 10. Weekly incidence of influenza (dominating type) for individuals aged 15–39 years in Sweden, 2016–2022 seasons (a).
(a) Season 2020–2021 is not included due to the small number of cases.
| Indicator | 2016–2017, A(H3N2) | 2017–2018, B/Yamagata | 2018–2019, A(H1N1)pdm09 | 2019–2020, mixed season | 2021-2022, A(H3N2) |
|---|---|---|---|---|---|
| Median age influenza A | 73 | 70 | 60 | 51 | 35 |
| Median age influenza B | 58 | 68 | 37 | 24 | 39 |
(a) Season 2020–2021 is not included due to the small number of cases.
Geographic distribution
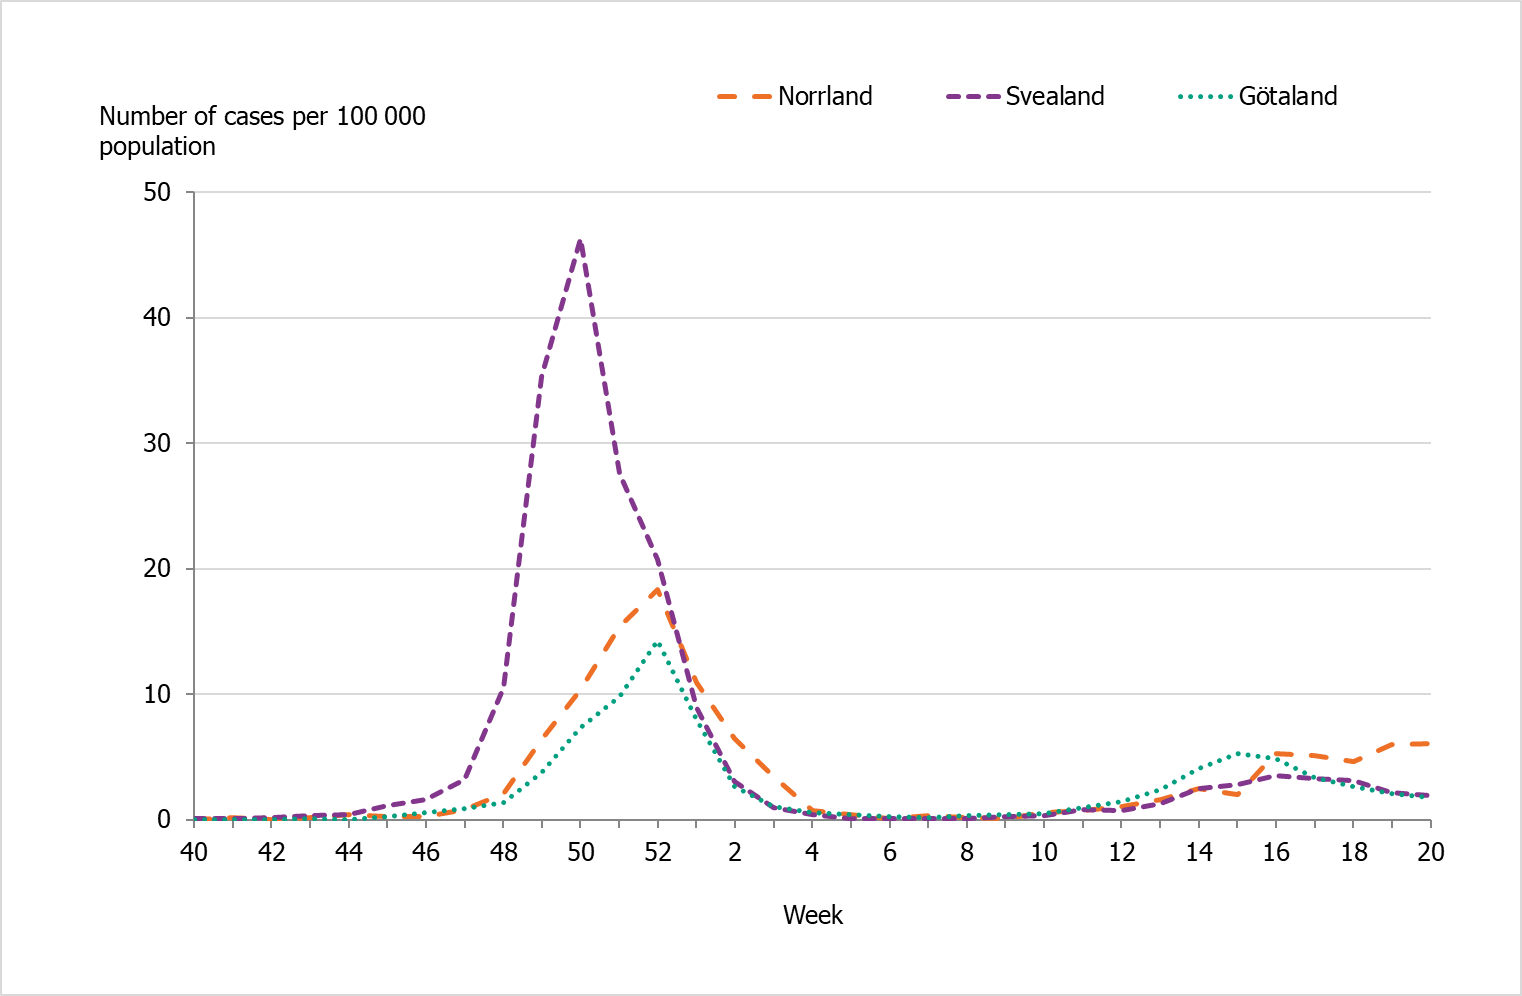
There were marked geographical differences within Sweden in the spread of influenza during the season. In the initial wave, the middle parts of Sweden (Svealand) had higher incidence in comparison to the southern (Götaland) and the northern (Norrland) parts of the country (Figure 11). Svealand had a peak in incidence in week 50, whereas Norrland followed by Götaland peaked in week 52 at a lower incidence. In January, the influenza activity decreased to a very low level in all regions, and only sporadic cases were reported during February to March. During the second wave, the incidence was higher in the southern (Götaland) part and the northern (Norrland) part of the country, but were overall lower than in the first wave. The percentage of samples positive for influenza had peaks in week 50 for the middle part of the country (Svealand), whereas the southern (Götaland) parts of the country and northern (Norrland) parts peaked in week 52.
Altogether, the middle parts of the country (Svealand) had the highest cumulative incidence of laboratory-confirmed cases this season, with 184 cases per 100,000 individuals, followed by the northern parts (Norrland) and southern parts (Götaland), both with 82 cases per 100,000 individuals. The greatest numbers of cases were reported from regions with large urban areas (Stockholm, Skåne, and Uppsala). However, in relation to population size, the counties of Uppsala, Västmanland, and Norrbotten had the highest cumulative incidence, and these counties also had higher than average sampling for influenza. The number of laboratory-confirmed cases might be affected by healthcare-seeking behaviour as well as differences in sampling in the various regions; thus, no direct conclusions can be drawn regarding actual influenza activity using the measured incidence.
Figure 11. Weekly incidence of laboratory-confirmed influenza per 100,000 population and county from week 40, 2021, to week 20, 2022.
Antiviral sales
Every Monday, the PHAS receives data from the Swedish eHealth Agency on the previous week's sales of the antivirals zanamivir and oseltamivir. Data include prescriptions and healthcare requisitions. Data on prescriptions reflect patients seeking medical care for influenza-like symptoms, whereas requisitions are a combination of medical staff preparations for intense periods as well as patients currently in treatment.
Cumulative sales of antiviral medications were at higher levels compared to the last season 2020–2021, but lower than during the last intensive influenza season of 2017–2018 (Table 6). During the 2021–2022 season, sales first increased steeply in the beginning of December (week 49) at the same time that influenza cases were increasing. This increase primarily reflected increased requisitions from hospitals and long-term care facilities. After this period, sales followed the pattern of influenza cases, decreasing through January and increasing again to another, smaller peak around the influenza peak in weeks 15–18. Sales of antivirals were lower than the number of influenza cases during the 2021–2022 season.
Table 6. Total antiviral sales and laboratory-confirmed influenza cases in the past six seasons.
| Indicator | 2016-2017 | 2017–2018 | 2018–2019 | 2019–2020 | 2020-2021 | 2021-2022 |
|---|---|---|---|---|---|---|
| Prescriptions | 4,806 | 7,120 | 6,086 | 5,263 | 774 | 2,154 |
| Health care requisitions | 10,262 | 12,790 | 10,534 | 7,252 | 1,370 | 4,869 |
| Total sales | 15,068 | 19,910 | 16,620 | 12,515 | 2,144 | 7,023 |
| Total influenza cases | 13,066 | 20,686 | 13,757 | 7,941 | 29 | 13,287 |
Influenza cases in intensive care
The PHAS receives data daily on influenza patients in intensive care through a collaboration with the Swedish Intensive Care Registry (SIR). A special module in the registry, known as SIRI, allows reporting of patients at an intensive care unit with laboratory-confirmed influenza. The module includes individual factors on underlying medical conditions, complications, antiviral treatment, vaccination status, influenza type and subtype, and other data for patients under treatment.
During the 2021–2022 season, 110 patients with influenza were reported as having received intensive care (Table 7). All of the patients had influenza A, and of 16 subtyped samples all were influenza A(H3). Of the patients in intensive care, 76 patients were admitted during the first wave of the epidemic and 34 patients during the second wave during the spring (Figure 12). The greatest number of patients were admitted to intensive care during week 51 and 52 (17 patients and 15 patients, respectively), just after the peak of laboratory-confirmed cases of influenza in week 50. In comparison to the four previous seasons, fewer patients were reported being in intensive care during the current season.
The majority of the patients (48 patients) were 65 years or older, followed by individuals aged 40–64 years (27 patients). The median age for influenza patients admitted to intensive care was 61 years. There was no significant difference in sex distribution, with 50 percent of cases of each sex.
Of all reported cases in intensive care, 80 patients (73 percent) were in a risk group for severe influenza illness, either due to age (65 years and older) or due to having one or more medical risk factors. Among patients under the age of 65 years, approximately half (32 patients, 52 percent) did not have a medical risk factor for severe influenza. Chronic heart-lung disease (47 patients), diabetes (25 patients), and immunosuppression (16 patients) were the most commonly reported risk factors during the season. Three of the patients were reported to be pregnant.
Vaccination status was known for 42 patients who were in risk groups and therefore recommended vaccination. Of these, 22 patients were vaccinated this season (52 percent). The majority (20 patients) of the patients that had been vaccinated were aged 65 years or older. The median age for vaccinated patients was 76 years.
Of the patients requiring intensive care, 26 individuals (24 percent) were reported to have died. The majority (92 percent) of the deceased had a medical risk factor or were aged 65 years or older and therefore were at increased risk of severe influenza infection. The median age of patients who died was 75 years.
Figure 12. Number of patients with influenza in intensive care by influenza type or subtype per week, 2021–2022 season.
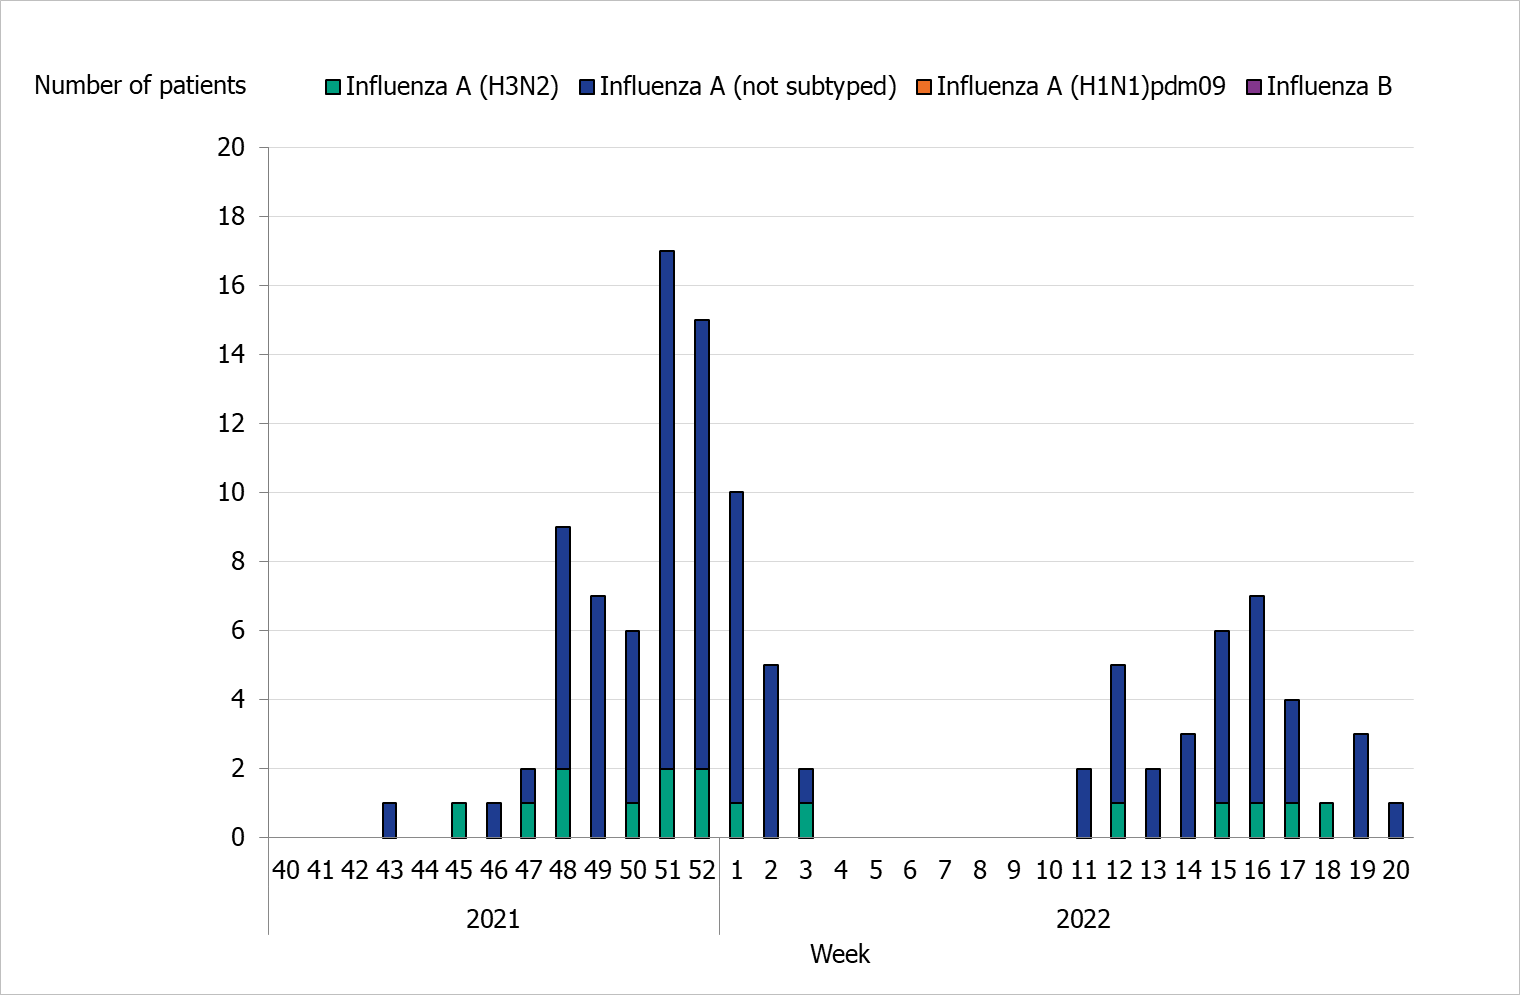
Table 7. Number of cases and median age of patients (in parentheses) in intensive care with influenza per influenza subtype, seasons 2016–2017 to 2021–2022 (a).
| Type or subtype | 2016–2017 | 2017–2018 | 2018–2019 | 2019–2020 | 2021-2022 |
|---|---|---|---|---|---|
| Influenza A (not subtyped) | 196 (73) | 139 (64) | 316 (64) | 109 (58) | 94 (62) |
| Influenza A(H1N1)pdm09 | 3 (82) | 9 (59) | 35 (64) | 24 (63) | 0 (-) |
| Influenza A(H3N2) | 50 (72) | 13 (72) | 6 (66) | 8 (73) | 16 (41) |
| Influenza B | 9 (66) | 291 (67) | 2 (74) | 34 (15) | 0 (-) |
| Total | 258 (72) | 452 (66) | 359 (64) | 175 (55) | 110 (61) |
(a) Season 2020–2021 is not included because only one case (influenza B) was reported during the season.
Incidence of patients in intensive care with influenza
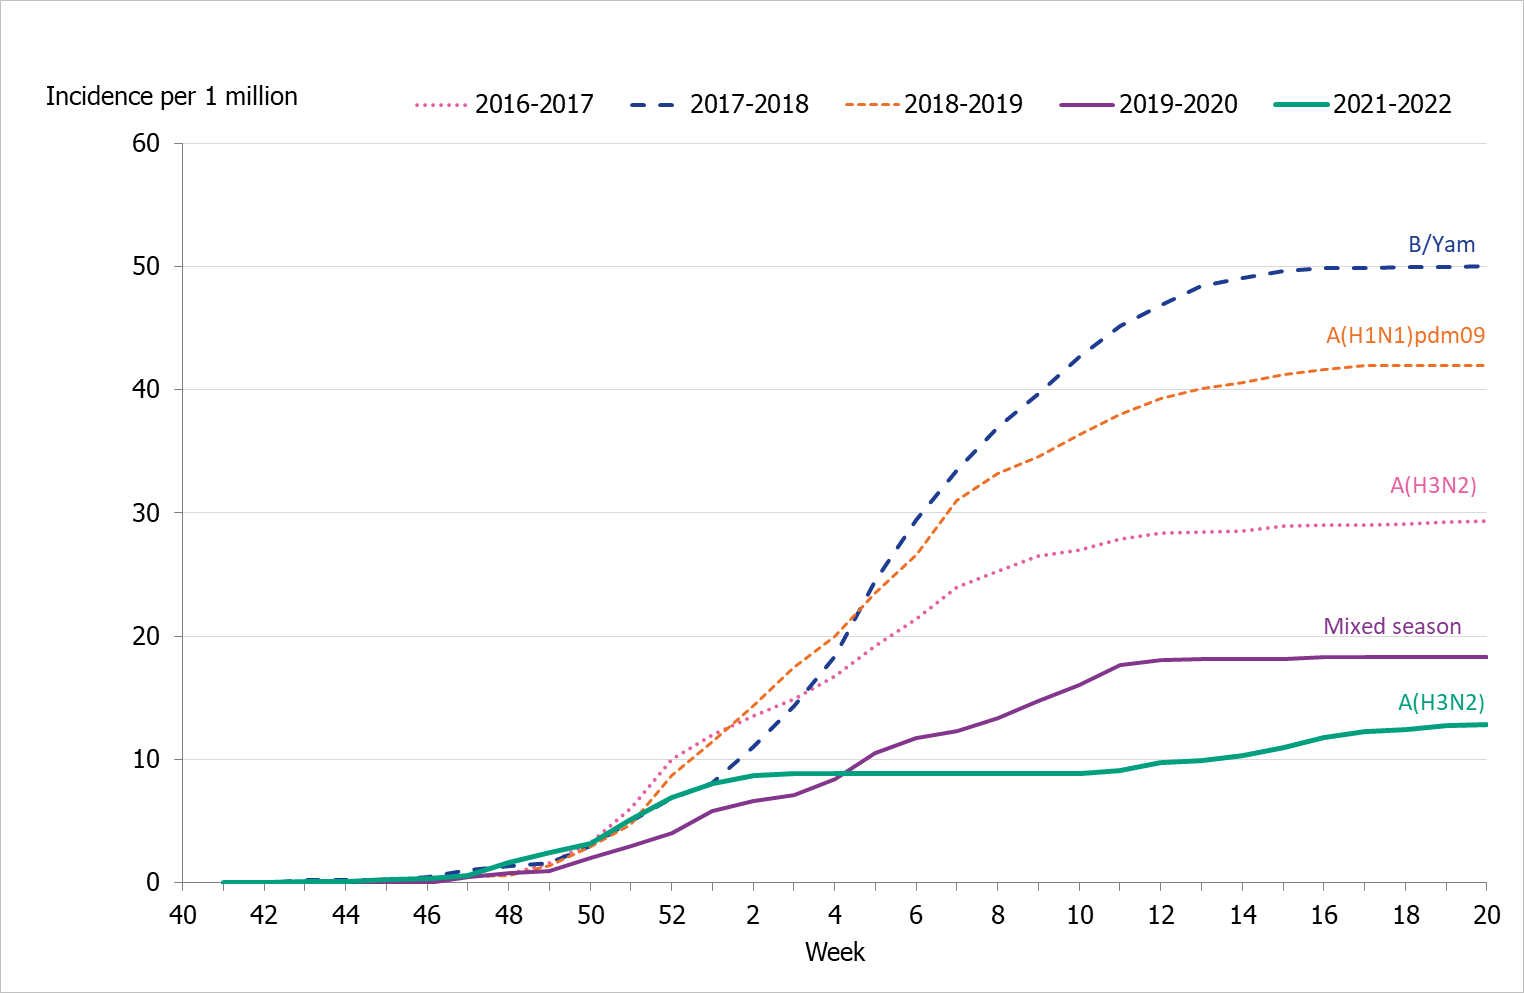
To enable comparison with the past seasons, we estimated the weekly incidence of patients in intensive care with influenza based on preliminary estimates of regional catchment population denominators. Compared with previous seasons, the highest peak in weekly incidence in weeks 51–52, 2021, was lower than most (Figure 13). The cumulative incidence was also lower than that of previous seasons and followed a somewhat different pattern due to the two waves of infection (Table 8, Figure 14).
Table 8. Number of patients and cumulative incidence per season, as well as the number of reporting ICUs, seasons 2016–2017 to 2021–2022 (a).
| Indicator | 2016–2017 | 2017–2018 | 2018–2019 | 2019–2020 | 2021-2022 |
|---|---|---|---|---|---|
| Total number of patients | 258 | 447 | 359 | 175 | 110 |
| Cumulative incidence per 1 million population (a) | 29 | 50 | 42 | 18 | 13 |
| Reporting ICUs | 49 | 53 | 51 | 51 | 48 |
(a) Season 2020–2021 is not included because only one case (influenza B/Victoria) was reported during the season.
(b) Incidence calculations use preliminary estimates of regional catchment population denominators for each region based on information about which ICUs have reported each season.
Figure 13. Weekly incidence of patients with influenza in intensive care in the last five seasons, 2016–2022. Season 2020–2021 not included due to low numbers.
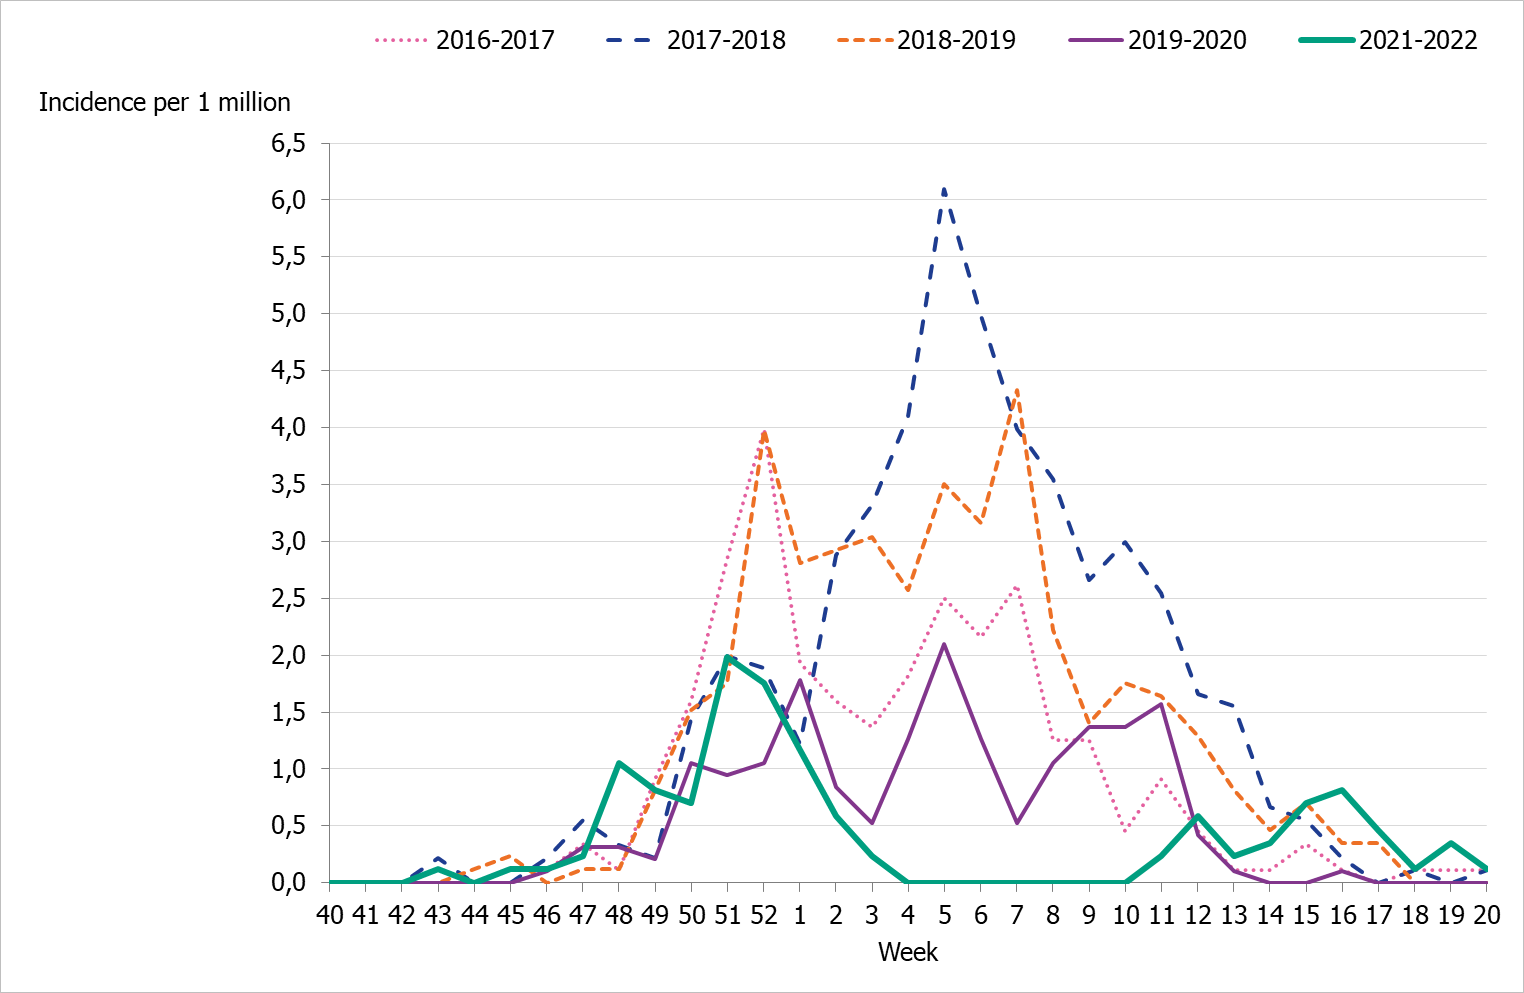
Figure 14. Cumulative incidence of patients with influenza in intensive care per week over the last five seasons, 2016–2022. Season 2020–2021 not included due to low numbers.
Influenza-related mortality
Influenza-related mortality is often noted during influenza seasons and varies with circulating strains and the intensity of the season. The PHAS uses different systems to measure influenza-related mortality.
Data on laboratory-confirmed influenza patients are intermittently linked to Swedish Tax Agency data on death in order to identify deceased individuals and to retrieve their dates of death. If 30 days or fewer have elapsed since the influenza diagnosis, the death is considered to be influenza related. This measurement is not specific nor is it sensitive. It is imprecise because a death within 30 days might have been caused by something else, and it is not sensitive because this measure does not include deaths if the diagnosis of influenza was not laboratory confirmed. Therefore, there are most likely a large number of unrecorded deaths from influenza. In addition, the data do not include information about underlying risk factors or complications of influenza infection. The analysis below includes data on cases reported until June 26, 2022 (Sunday week 25). Status after 30 days could not be ascertained for 207 cases without a national identification number.
To better estimate mortality, a model is used to identify excess mortality during the influenza season using the aggregate number of deaths in Sweden per week. The EuroMOMO model estimates the crude excess mortality for the whole country by age group and regionally.
Deaths within 30 days of influenza diagnosis
In total, 296 of 13,749 persons who received a laboratory-confirmed influenza diagnosis during the 2021–2022 season died within 30 days of diagnosis. This corresponds to 2 percent of the laboratory-confirmed cases, which is lower compared to the previous five seasons for which this analysis has been possible (range 3–5.5 percent, see Table 9). Within the 30 days, most (76 percent) of those who died did so within 15 days of diagnosis.
Within the season, most deaths among laboratory-confirmed cases occurred during the first wave of the season (67 percent died between week 40 and week 6), with the highest number of deaths occurring in week 1, 2022 (39 deaths), see Figure 15.
Patients who died had a median age of 84 years of age, and patients who did not die within 30 days of diagnosis had a median age of 35 years, which reflects the high rate of testing among people under 65 years of age during the season and the burden of severe influenza illness among the elderly. In total, 7 percent of all people aged 65 and older who had a laboratory-verified influenza died within 30 days, which is similar to the 2018–2019 season, which was of low intensity. During the 2021–2022 season, influenza A(H3N2) was dominant, which is similar to the 2016–2017 season; however, incidence of reported cases in the older age groups was lower (see Age and sex distribution).
Of deaths occurring within 30 days of sampling, nearly all had an influenza A diagnosis (288 people). Four of those who died had both influenza A and B, and four had influenza B. This is reflective of the low circulation of influenza B during the season (see Subtyping and lineage determination). Of those who had not died within 30 days, 99 percent had influenza A, and less than 1 percent had influenza B (125 cases) or both influenza A and B (68 cases). For most of those with influenza A who died within 30 days, no subtype was specified (90 percent, 260 patients), while 29 were influenza A(H3N2) and 1 was influenza A(H1N1)pdm09.
Slightly more women than men died within 30 days of an influenza diagnosis (51 percent of the deaths were among women), but the difference was not statistically significant.
Figure 15. Deaths among laboratory-confirmed influenza cases per week of death, 2021–2022 season.
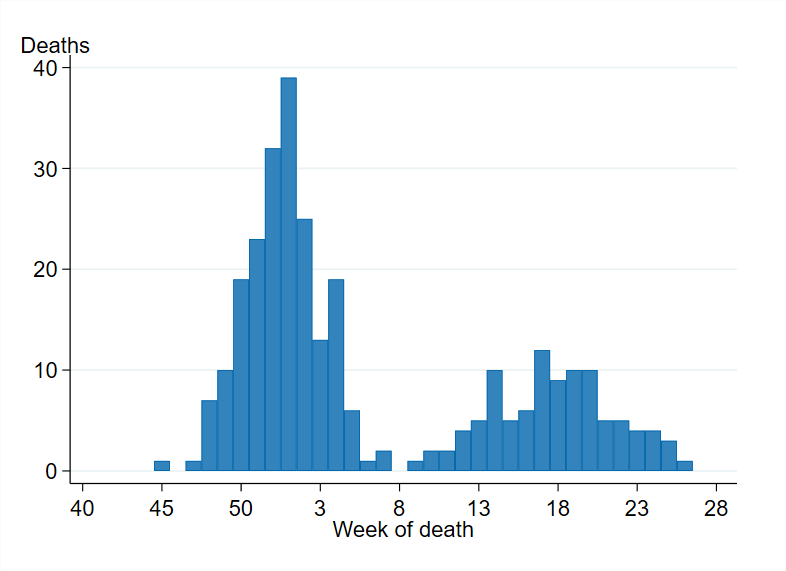
Table 9. Summary data for deaths within 30 days of laboratory-confirmed diagnosis (all types of influenza), 2015–2016 to 2021–2022.
| Influenza season and dominant type | Cases | Deaths | Percent deceased | Percent of 65+ who died | Median age of deaths | Median age of survivors |
|---|---|---|---|---|---|---|
| 2015–2016, A(H1N1)pdm09 | 8 915 | 255 | 3% | 8% | 75 yrs | 43 yrs |
| 2016–2017, A(H3N2) | 13 087 | 734 | 6% | 8% | 85 yrs | 72 yrs |
| 2017–2018, B/Yamagata | 20 438 | 1012 | 5% | 8% | 84 yrs | 67 yrs |
| 2018–2019, A(H1N1)pdm09 | 13 324 | 505 | 4% | 7% | 81 yrs | 59 yrs |
| 2019–2020, mixed season | 7 799 | 218 | 3% | 9% | 81 yrs | 36 yrs |
| 2020–2021, no season | 29 | 0 | (a) | |||
| 2021–2022, A(H3N2) | 13,749 | 296 | 2% | 7% | 84 yrs | 35 yrs |
(a) During the 2020-2021 season, none of 29 reported cases had died within 30 days. Median age is not calculated due to low numbers.
In total, approximately 91 percent of deaths within 30 days occurred among people aged 65 years and older, while 6 percent of deaths occurred among adults aged 40–64 years and 3 percent occurred in people under the age of 40 years, see Table 10. The proportion of deaths within 30 days increased with increasing age and varied from 0.1 percent for persons aged under 40 years to 19 percent for people 95 years and older. The analyses were not adjusted for expected mortality per age group.
Table 10. Number and incidence of laboratory-confirmed influenza cases (A and B) and deaths within 30 days of diagnosis, by age group, based on cases with age reported.
| Indicator | <40 years | 40–64 years | 65–69 years | 70–74 years | 75–79 years | 80–84 years | 85–89 years | 90–94 years | ≥95 years | Total |
|---|---|---|---|---|---|---|---|---|---|---|
| Total Cases | 7,454 | 2,475 | 472 | 643 | 785 | 729 | 609 | 415 | 167 | 13,749 |
| Cases/100,000 | 145 | 77 | 87 | 120 | 163 | 251 | 364 | 534 | 709 | 132 |
| Total Deaths | 9 | 18 | 13 | 16 | 42 | 54 | 57 | 55 | 32 | 296 |
| Deaths/100,000 | 0,2 | 1 | 2 | 3 | 9 | 19 | 34 | 71 | 136 | 3 |
| Deaths among cases | 0,1% | 1% | 3% | 2% | 5% | 7% | 9% | 13% | 19% | 2,2% |
This analysis includes all laboratory-confirmed influenza cases from week 40, 2021, to week 25, 2022. It excludes 207 patients whose personal identification number was not included in the case report, meaning that their status at 30 days could not be ascertained.
Excess mortality
During the 2021–2022 influenza season, excess mortality was noted during week 1, which could be related to the first wave of the influenza season but could also be related to the ongoing circulation of COVID-19. This was followed by excess mortality during week 4 and 5, which was likely due to the high level of COVID-19 transmission at the time.
Influenza-related mortality is more often seen in the age group 65 years and older and mainly during seasons dominated by influenza A(H3N2). Older people are the most fragile in terms of the risk of dying from influenza. Despite the fact that influenza A(H3N2) dominated the season, excess mortality that could be influenza-related was lower than during intense seasons dominated by influenza A(H3N2) and during 2017–2018, which was dominated by B/Yamagata, likely due to the lower intensity of spread this season.
Sentinel sampling
A network of sentinel sampling sites for influenza surveillance was established in Sweden (1999). The active sentinel sampling sites are mainly general practitioners (GPs), but paediatric clinics and infectious disease clinics are also part of the network.
Virological analysis of samples from sentinel sites contributes to national and international surveillance of circulating influenza viruses. In order to estimate what proportion of the patients seeking care for influenza-like illness (ILI) or acute respiratory infection (ARI) actually has influenza, sites are encouraged to collect nasal samples from symptomatic patients. The samples are sent to the PHAS for initial PCR analysis of influenza and SARS-CoV-2 (included since week 10, 2020). Samples with positive findings from the PCR-analysis are further analysed and the viral strains are characterized. The PHAS carries out laboratory analyses free of charge for these samples. Patient characteristics, including age, sex, risk factors, syndrome (ILI vs. ARI), and vaccination status, are included in the analysis of the virological findings.
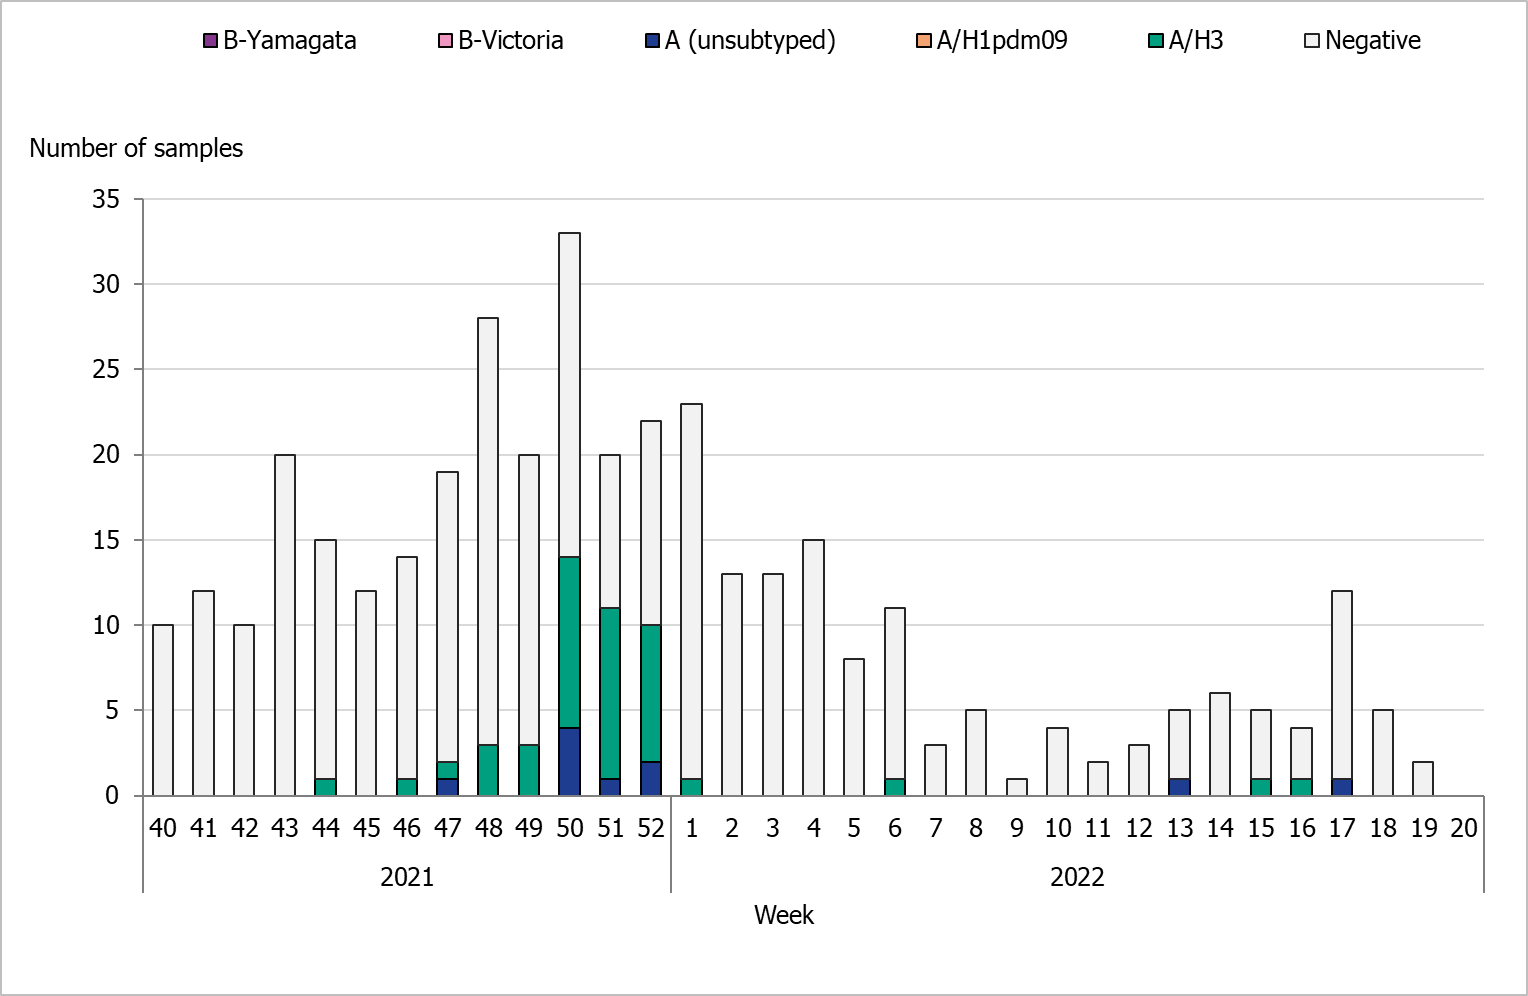
During the 2021–2022 season, 376 sentinel samples were submitted from 35 GP sites, and none of the paediatric or infectious disease clinics provided samples. In total, 52 samples (14 percent) tested positive for influenza. Figure 16 shows the distribution of samples taken and the positive samples by subtype/lineage. The first positive sentinel sample was taken week 44, and the highest number of positive cases was seen in week 50. During the second epidemic wave in the spring, some positive cases were detected in sentinel surveillance. This pattern was seen in other surveillance systems. Due to late circulation in 2022, the sentinel monitoring of influenza continued after week 20.
All positive samples were confirmed as influenza A and none as influenza B. Of the subtyped influenza A-positive samples, 42 (81 percent) could be typed and belonged to influenza A(H3). No cases of influenza A(H1)pdm09 were found within the sentinel samples. Ten influenza A samples (19 percent) could not be subtyped due to low virus concentration. Of the positive samples, two were co-infections of influenza A and SARS-CoV-2. One of the influenza-positive samples could be subtyped as A(H3), while the other could not be subtyped.
As a consequence of different aspects of the pandemic, the activity of sentinel sampling sites during the 2021–2022 season has been limited, and hence less data from sentinel sampling have been collected. As a part of the continued work on integrated influenza and SARS-CoV-2 surveillance, sentinel surveillance will be strengthened going forward through the recruitment of more sentinel sampling sites. The main goal is to ensure geographical representativeness of the population at national and regional levels.
Figure 16. Number of sentinel samples submitted each week, number of samples by subtype/lineage, and the percentage positive, 2021–2022.
Clinical features
Of the 376 patients sampled through the sentinel system with known symptoms, 90 percent had ILI and 10 percent had ARI. In total, 60 percent of the samples came from women. Thirty-five percent of the samples were collected from patients belonging to a risk group due to age and/or medical condition (n = 131). Of these, 75 percent were aged 65 years or older (n = 98). The most common reported medical risk factors were lung disease (n = 22), heart disease (n = 16), diabetes (n = 13), immunosuppression (n = 10), and pregnancy (n = 1). The tables below summarise the laboratory results from the sentinel sampling system for the last three seasons, including the number of samples (Table 11), median age, ILI percentage, and sub/lineage type (Table 12).
Table 11. Number of analysed samples, negative and positive samples, and percentage positive within the sentinel sampling system for the last three epidemic seasons.
| Samples | 2018–2019 | 2019–2020 | 2021-2022 |
|---|---|---|---|
| Analysed | 1,323 | 2,102 | 376 |
| Negative | 915 | 1,718 | 324 |
| Positive | 408 | 384 | 52 |
| Proportion positive | 31% | 18% | 14% |
| Positive for influenza A | 403 | 218 | 52 |
| Positive for influenza B | 5 | 166 | - |
Table 12. Number, median age, and proportion of patients with ILI for the analysed samples and positive samples by sub/lineage type for the past three epidemic seasons.
| Type or subtype | 2018–2019 number | 2018–2019 median age | 2018–2019 ILI % | 2019–2020 number | 2019–2020 median age | 2019–2020 ILI % | 2021-2022 number | 2021-2022 median age | 2021–2022 ILI % |
|---|---|---|---|---|---|---|---|---|---|
| Analysed | 1,323 | 41 | 92 | 2,102 | 40 | 81% | 376 | 51 | 90 |
| A(H1N1)pdm09 | 299 | 38 | 95 | 125 | 35 | 92 | 0 | - | - |
| A(H3N2) | 92 | 38 | 96 | 87 | 22 | 88 | 42 | 24,5 | 100 |
| A, not subtyped | 12 | 53 | 73 | 6 | 32 | 83 | 10 | 51 | 90 |
| B/Victoria | 4 | 13 | 100 | 166 | 14 | 89 | - | - | - |
| B/Yamagata | 1 | (a) | 100 | 0 | - | - | - | - | - |
| B, positive for both lineages | 0 | - | - | 0 | - | - | - | - | - |
(a) Median age is not shown for single cases.
Influenza infection among vaccinated patients
Vaccination status was reported for 283 (75 percent) of the 376 patients sampled during the season. Of these, 86 (30 percent) were vaccinated. Among the patients belonging to a risk group (131), 49 percent were vaccinated.
Influenza A was detected among 5 vaccinated patients. Influenza A(H3) was detected in 4 patients, and one patient had non-subtyped influenza A.
The PHAS participates in the European Influenza Monitoring Vaccine Effectiveness (I-MOVE) network with data from Swedish sentinel sampling. In the end-of-season report for 2021–2022 (1), the vaccination effect was high for influenza A(H1N1)pdm09 (75 percent, 95% CI: 43–89 percent) and lower for influenza A(H3N2) (31 percent, 95% CI: 15–43 percent) for all ages. The estimated vaccination effect for influenza A(H3N2) was not significant in the age group 65 years and older (estimate 31 percent, 95% CI: –11 to 58 percent). No estimate was available for influenza B due to limited circulation.
Virus characterisation
Subtyping and lineage determination
All diagnostic laboratories perform influenza typing using molecular assays for influenza A and B and some perform subtyping of influenza A. The PHAS performs subtyping and lineage typing by real-time PCR for all samples sent in from the diagnostic laboratories and on all positive samples from sentinel surveillance.
In Sweden, influenza A(H3N2) dominated the 2021–2022 season, and circulation of influenza B and A(H1N1)pdm09 was limited. In total, 1,114 influenza A-positive samples from laboratories in Sweden were subtyped during the season, of which 1,102 (99 percent) were A(H3) and 124 (1 percent) were A(H1)pdm09. The lineage was determined for 13 influenza B-positive samples. All belonged to the B/Victoria lineage and none to the B/Yamagata lineage. Typing results for subtype and lineage from sentinel and laboratory reporting systems are presented in Table 13.
In the sentinel sampling system, a higher proportion of influenza A(H1N1)pdm09 and influenza B than influenza A(H3N2) is usually detected during mixed seasons such as 2019–2020. In the sentinel system, patients are sampled by their GPs and generally have milder disease. When influenza A(H3N2) is dominating, influenza usually more severely affects older age groups, resulting in a higher proportion of A(H3N2) detected in the laboratory surveillance system because these samples are primarily taken at hospitals.
Table 13. Proportion of positive subtyped samples within the sentinel sampling system (Sent.) and laboratory reporting systems (Lab) by subtype/lineage for the past five epidemic seasons (a).
| Influenza type | 2016–2017 Sent. | 2016–2017 Lab | 2017–2018 Sent. | 2017–2018 Lab | 2018–2019 Sent. | 2018–2019 Lab | 2019–2020 Sent. | 2019–2020 Lab | 2021–2022 Sent. | 2021–2022 Lab |
|---|---|---|---|---|---|---|---|---|---|---|
| A(H1N1)pdm09 | 1% | <1%> | 6% | 13% | 76% | 63% | 33% | 25% | 0% | 1% |
| A(H3N2) | 96% | >99% | 17% | 23% | 23% | 37% | 23% | 44% | 100% | 98% |
| B/Victoria | 1% | <1%> | <1%> | <1%> | 1% | <1%> | 44% | 31% | 0% | 1% |
| B/Yamagata | 2% | <1%> | 77% | 64% | <1%> | <1%> | 0% | 0% | 0% | 0% |
(a) Season 2020–2021 is not included due to the small number of cases.
Genotypic and phenotypic characterisation
A selection of the influenza-positive samples from laboratories and from the sentinel surveillance programme are genetically characterised though whole genome sequencing (NGS on an Ion Torrent platform), and viruses isolated on cell culture undergo phenotypic sensitivity to neuraminidase (NA) inhibitors using a MUNANA-based NA inhibition assay. Samples are selected to be as representative as possible in terms of geographical location, period of collection, and type/subtype/lineage type. The Swedish laboratories are also asked to send influenza-positive samples from severely ill or deceased patients, patients with vaccine break-through infections, and patients who do not respond to antiviral treatment. These samples all undergo further characterisation if the viral load is high enough. Genetic characterisation and virus isolation is usually successful for samples with a real-time PCR Ct-value ≤30 or below.
The hemagglutinin (HA) gene is further analysed and affiliated to genetic groups in accordance with ECDC influenza characterisation guidelines. In addition, the parts of the HA gene that are the target for the subtype/lineage-specific real-time PCR systems used at the PHAS are analysed for sequence mismatches compared to primers and probes used in these systems. The NA gene is analysed with respect to amino acid substitutions previously shown to be associated with reduced or highly reduced inhibition by the NA inhibitors oseltamvir (Tamiflu®/Ebilfumin®), and zanamivir (Relenza®). The PA gene is analysed with respect to amino acid substitutions previously shown to be associated with a >3-fold increase in IC50-value for baloxavir marboxil (Xofluza®). The matrix gene of influenza A viruses is analysed with respect to amino acid substitutions previously shown to result in resistance to amantadine. The parts of the matrix gene sequences of influenza A and B that are targets in the real-time PCR systems that are used for detection of influenza at the PHAS are analysed for mismatches to the PCR primers and probes.
Phenotypic analysis of susceptibility to the NA inhibitors oseltamivir and zanamivir is performed with the neuraminidase inhibition (NAI) assay on a selection of the cell-propagated virus with the aim to cover all NA-sequence variants.
A representative selection of the isolated virus samples is sent to the WHOCC in London for antigenic characterisation and for phenotypic analysis of susceptibility to NA inhibitors with the NAI assay.
Characterisation data are continuously reported to ECDC via TESSy, and sequence data are continuously uploaded to the Global Initiative on Sharing All Influenza Data (GISAID).
Genetic groups
The genetic groups of the 175 characterised Swedish influenza A and B viruses from the 2021–2022 season are shown in Tables 14A through C by influenza subtype or lineage and in the phylogenetic trees in Appendices 1–3. Of the characterised viruses, 158 were subtype A(H3N2), 6 were subtype A(H1N1)pdm09, and 11 were lineage type B/Victoria.
Table 14A. Genetic groups based on the hemagglutinin gene sequence of the characterised Swedish influenza A(H3N2) viruses in season 2021–2022.
| Genetic group | Number of viruses (Percentage of viruses) | Comment |
|---|---|---|
| 3C.2a1b.2a.1 | 0 (0%) | Genetic group affiliation of the recommended vaccine virus for northern hemisphere season 2021–2022 (6). |
| 3C.2a1b.2a.2 | 150 (95%) | Genetic group affiliation of the recommended vaccine virus for northern hemisphere season 2022–2023 (7). Dominant (99%) genetic group among viruses reported within the European surveillance until week 20 2022 (8). |
| 3C.2a1b.1a | 8 (5%) | – |
| 3C.2a1b.1b | 0 (0%) | – |
| 3C.3a1 | 0 (0%) | – |
Table 14B. Genetic groups based on the hemagglutinin gene sequence of the characterised Swedish influenza A(H1N1)pdm09-viruses in season 2021–2022.
| Genetic group | Number of viruses (Percentage of viruses) | Comment |
|---|---|---|
| 6B.1A.5a.1 | 5 (83%) | Dominant (91%) genetic group among viruses reported within the European surveillance until week 20, 2022 (8). |
| 6B.1A.5a.2 (India/Pun-NIV312851/2021) | 1 (17%) | – |
| 6B.1A.5a.2 (Victoria/2570/2019) | 0 (0%) | Genetic group affiliation of the recommended vaccine virus for northern hemisphere seasons 2021–2022 and 2022-2023 (6, 7). |
| 6B.1A.7 | 0 (0%) | – |
Table 14C. Genetic groups based on the hemagglutinin gene sequence of the characterised Swedish influenza B/Victoria-viruses in season 2021–2022.
| Genetic group | Number of viruses (Percentage of viruses) | Comment |
|---|---|---|
| V1A, 1A del162-164B (Vaccine) | 0 (0%) | – |
| V1A.3 | 0 (0%) | Genetic group affiliation of the recommended vaccine virus for northern hemisphere season 2021–2022 (6). Genetic group affiliation for 37% of the viruses reported within in the European surveillance. |
| V1A.3a.1 | 0 (0%) | – |
| V1A.3a.2 | 11 (100%) | Genetic group affiliation of the recommended vaccine virus for northern hemisphere season 2022–2023 (7). Genetic group affiliation for 57% of the viruses reported within the European surveillance (8). |
No antigenic analyses are performed at the PHAS. The general antigenic properties of the genetic groups have, however, been summarised in the report by the WHO in conjunction to the influenza vaccine composition recommendation meeting for the northern hemisphere 2022–2023 held in February 2022. The antigenic analyses with ferret antisera raised against the respective vaccine viruses included in the northern hemisphere vaccine 2021–2022 showed the following (7):
- A(H3N2): Antisera raised against viruses similar to the vaccine virus A/Cambodia/e0826360/2020 (genetic group 3C.2a1b.2a.1) reacted poorly with viruses in the genetic group 3C.2a1b.2a.2, while viruses in genetic groups 3C.2a1b.1a and 3C.2a1b.1b were recognized well by ferret antisera raised against cell culture-propagated but not egg-propagated A/Cambodia/e0826360/2020-like viruses.
- A(H1N1)pdm09: Antisera raised against the cell culture-propagated vaccine virus A/Victoria/2570/2019 or the egg-propagated vaccine virus A/Wisconsin/588/2019 (both genetic group 6B.1A.5a.2) reacted well against viruses in genetic group 6B.1A.5a.2 but poorly against the 6B.1A.5a.1 viruses.
- B/Victoria: Viruses in genetic group V1A.3 were recognized well by antisera raised against the vaccine virus B/Washington/02/2019 (genetic group V1A.3), while V1A.3a.1 and V1A.3a.2 were recognized poorly.
Antiviral susceptibility
The NA gene of 158 influenza A(H3N2), 6 influenza A(H1N1)pdm09, and 11 influenza B/Victoria viruses were sequenced and analysed for amino acid substitutions previously shown to be associated with reduced or highly reduced inhibition by the NA inhibitors oseltamivir and zanamivir. In addition, 10 A(H3N2) and 1 A(H1N1)pdm09 virus were analysed for phenotypic sensitivity to oseltamivir and zanamivir by WHOCC in London. All 11 viruses were shown to be sensitive to both inhibitors in this analysis. Additional phenotypic results are pending from both the PHAS and the WHOCC.
The PA gene of 151 A(H3N2), 6 influenza A(H1N1)pdm09, and 10 B/Victoria viruses was sequenced, and none of the amino acid substitutions previously shown to be associated with a >3-fold increase in IC50-value to baloxavir were detected.
The amino acid substitution S31N in the matrix protein, which confers resistance to amantadine, was present in all 170 Swedish influenza A viruses [163 A(H3) and 7 A(H1)pdm09].
Virus isolation on cell culture
Influenza-positive samples for virus isolation on MDCK-SIAT1 cells were selected from samples collected through the sentinel sampling and from samples sent to the PHAS from the Swedish laboratories. Samples are selected for virus isolation based on genetic properties of the virus as determined by sequence analysis, geographical location, period of collection, and type/subtype/lineage type. In addition samples of special interest are selected for virus isolation, for example, samples from severely ill or deceased patients, patients with vaccine break-through infections, and patients who do not respond to antiviral treatment. Samples with a Ct-value >30, as well as samples known to have been inactivated in the laboratory are not selected for isolation. A total of 42 viruses [34 A(H3N2), 2 A(H1N1)pdm09, and 6 B/Victoria] were successfully isolated on MDCK-SIAT1 cells. Of these, 30 virus isolates along with 23 matching clinical samples were sent to the WHOCC London for further characterisation in December 2021 and June 2022.
Recommended vaccine composition
In February 2022, the WHO recommended that the quadrivalent vaccines for use in the northern hemisphere in the 2022–2023 season contain the following viruses (7).
Egg-based vaccines
The WHO recommends that the following viruses be included in egg-based vaccines:
- A/Victoria/2570/2019 (H1N1)pdm09-like virus
- A/Darwin/9/2021 (H3N2)-like virus
- B/Austria/1359417/2021 (B/Victoria lineage)-like virus
- B/Phuket/3073/2013 (B/Yamagata lineage)-like virus
Cell-based or recombinant-based vaccines
The WHO recommends that the following viruses be included in cell-based or recombinant-based vaccines:
- A/Wisconsin/588/2019 (H1N1)pdm09-like virus
- A/Darwin/6/2021 (H3N2)-like virus
- B/Austria/1359417/2021 (B/Victoria lineage)-like virus
- B/Phuket/3073/2013 (B/Yamagata lineage)-like virus
For trivalent vaccines, exclusion of the B/Phuket/3073/2013-like virus is recommended.
Vaccination coverage
There is no national register for influenza vaccinations in Sweden, but data on vaccination coverage among persons 65 years of age and older have been gathered by Sweden’s 21 county medical officers for their respective county councils since 2003. The PHAS took over this task in 2014. Various methods for estimation have been used in different counties, including the use of vaccination registries, the number of vaccine doses given or distributed, sentinel reports on vaccination coverage, surveys among general practitioners, and patient record data. These methodological differences result in coverage estimates of varying quality and precision. Although the methods vary between counties, the methods within most counties have been roughly the same for the past several years, allowing a comparison over time. An estimate of the vaccination coverage in age groups younger than 65 is included, using data from a subset of county councils where registry data by age group are available throughout the season as well as annually. Data for 2021–2022 come from Gävleborg, Jämtland Härjedalen, Jönköping, Kalmar, Kronoberg, Norrbotten, Stockholm, Sörmland, Värmland, Västernorrland, Västmanland, and Östergötland.
Coverage among persons 65 years of age and older
The national vaccination rate among persons aged 65 and older was approximately 70 percent in 2021–2022, which was five percentage points higher than the previous season (see Figure 17). The increase is likely due to a combination of increased interest in influenza vaccination and the concomitant administration of influenza vaccines with COVID-19 booster vaccines for those aged 65 years or older.
The PHAS estimates that just under 1.5 million people aged 65 and older were vaccinated this season. Coverage was, as in previous seasons, highest among people aged 85 and older (75 percent), followed by those aged 75–84 years (74 percent, see Table 15).
Figure 17. Vaccination coverage among persons aged 65 and older in Sweden, 2010–2011 to 2021–2022.
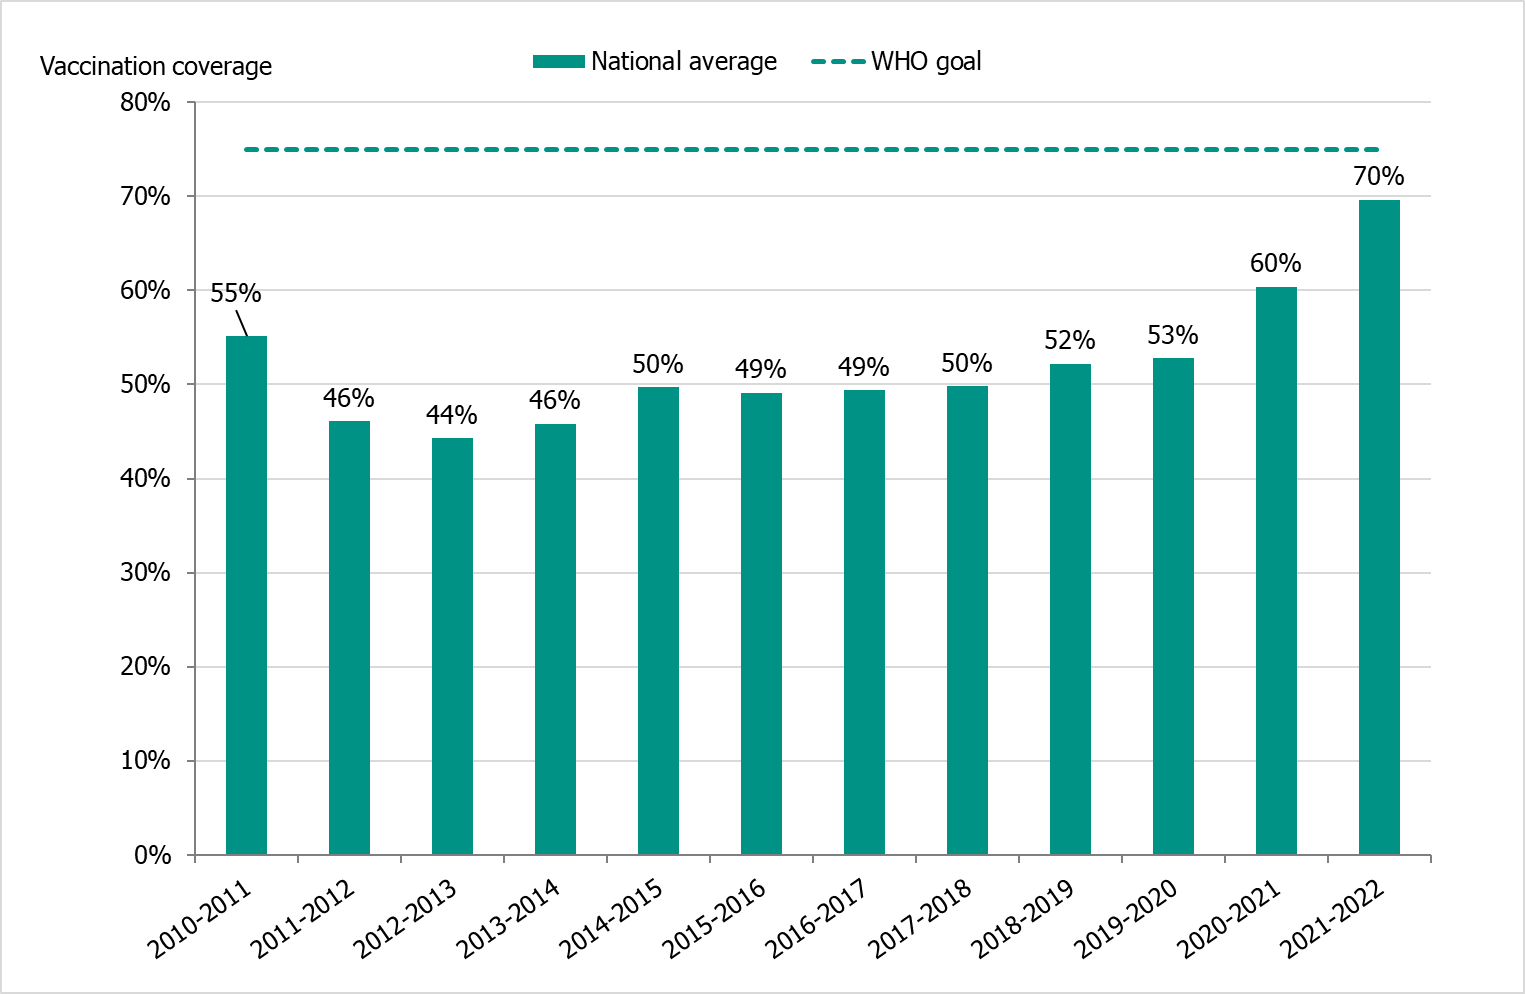
Vaccinations began at the end of October at long-term care facilities, where high-dose vaccines were used. The public vaccination campaign started on November 9, 2021 (week 45), during which quadrivalent standard-dose vaccines were used.
Regional differences in vaccination coverage
Comparisons among county councils are difficult because estimates use different methods and there is uncertainty associated with each value. Figure 18 gives a picture of the current vaccination coverage rates for the age group 65 years and older throughout Sweden. For more regional data and collection methods, see the Swedish-language summary of the season published in July 2022 (4).
Figure 18. Estimated proportion of vaccinated persons aged 65 and older per county council in Sweden for seasons 2020–2021 and 2021–2022 (a).
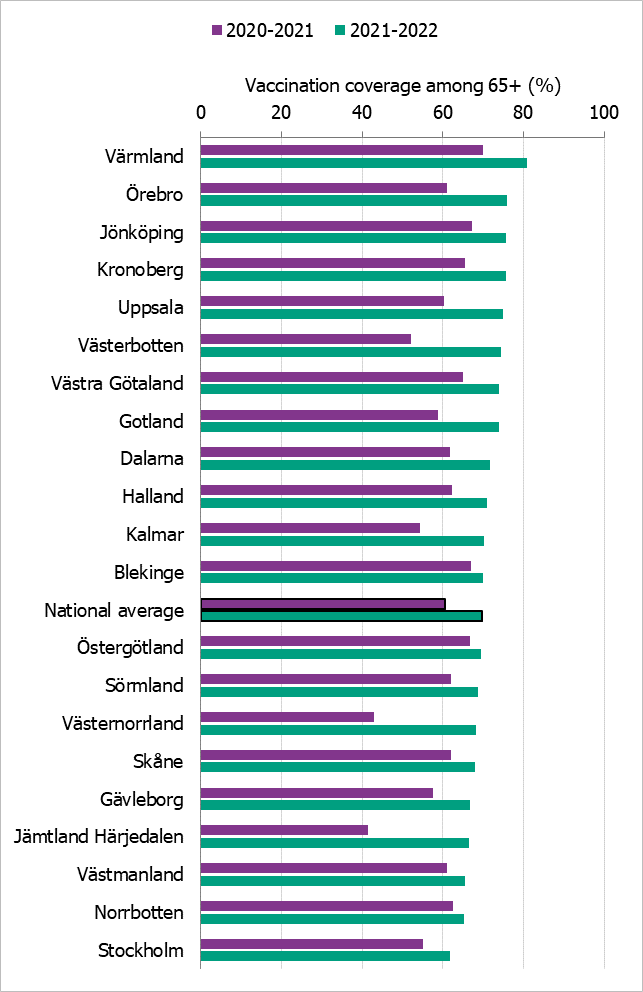
(a) Notes: Different methods to estimate coverage were used in each county, which makes comparison difficult. Percentages were calculated using the county population on December 31 of each year (Source: Statistics Sweden).
The data from Gotland come from a patient record system and directly from private healthcare offices. Data for 2021–2022 from some smaller private providers are missing. Data from Halland do not include data on county staff or some of the regional staff. The data from Jämtland Härjedalen include vaccinations given within the regional healthcare system, and doses given at elder care and other facilities are under-reported. Skåne has changed data source to a patient record system for 2021–2022 from a financial system and registry. Data from Stockholm only include vaccinations given to people in medical risk groups (including pregnancy) or those aged 65 years or older. Sörmland and Norrbotten changed data sources from registries to patient record systems on Mar 8, 2022, and Dec 13, 2021, respectively. For Norrbotten, data on regional healthcare staff vaccination are missing. Västmanland has a new registry, but all doses have not been registered. Uppsala data are based on data from a patient record system and reports from private healthcare clinics as a basis for remuneration. Data on vaccinations given in elderly care may be incomplete. Data from Värmland do not include data from private healthcare clinics. Örebro uses data from primary care patient records, which includes doses given to patients in county care facilities and doses given at private healthcare clinics, but doses given in hospitals are not included. Data from Östergötland are based on patient records that include patients in county care facilities and the regional healthcare system, but not vaccinations given at private healthcare clinics, at pharmacies, or through occupational health services.
Vaccination coverage among persons under 65 years
It is difficult to estimate vaccination coverage among the medical risk groups under 65 years of age because these groups are hard to define and because data are often missing. Twelve county councils (see note under Table 15) have reported the number of persons vaccinated under 65 years of age, although risk group status is often unknown. See Table 15 for a breakdown by age group.
Table 15. Percentage vaccinated per age group, 2020–2021 and 2021–2022.
| Age group | 0–17 yrs | 18–39 yrs | 40–64 yrs | 65–74 yrs | 75–84 yrs | 85+ yrs |
|---|---|---|---|---|---|---|
| Percentage vaccinated 2020–2021 (%) | 0.4 | 2.4 | 6.6 | 53 | 65 | 64 |
| Percentage vaccinated 2021–2022 (%) | 0.3 | 2.7 | 8.5 | 61 | 74 | 75 |
| Population (31 Dec 2021) | 1,153,802 | 1,538,763 | 1,692,164 | 555,964 | 401,401 | 137,999 |
Data come from Gävleborg, Jämtland Härjedalen, Jönköping, Kalmar, Kronoberg, Norrbotten, Stockholm, Sörmland, Värmland, Västernorrland, Västmanland, and Östergötland.
Syndromic surveillance
Two systems of syndromic surveillance were used during the 2021–2022 influenza season – Webbsök (Web search) and telephone calls to the medical advice line 1177 Vårdguiden. Webbsök is an automated system established in 2008 that uses a statistical model and completely anonymous data from a medical advice website to estimate the development of sentinel ILI incidence. Data are received daily and analysed weekly. The results are published on the web every Monday during the influenza season in the form of a graph (9), which is three days ahead of the publication of the weekly influenza bulletin.
In collaboration with the medical telephone advice line 1177 Vårdguiden, the PHAS receives aggregated weekly data on calls from a system called Hälsoläge. The age group and main reason for calling are registered for all callers. The reported data include the number of calls related to cough, fever, and sore throat. The proportion of calls related to fever in children has been found to be a good indicator of influenza activity in the community.
Web search data (Webbsök)
According to Webbsök, the 2021–2022 influenza season lasted for 4 weeks, from weeks 49–52, 2021 (Figure 19). The influenza activity was at low levels throughout the season. Between week 27, 2021, and week 26, 2022, a total of 287,742 queries related to influenza were entered, which was 3 percent of the total number of queries on the website 1177.se.
Webbsök had one peak, in week 51, 2021, which rapidly decreased. The peak corresponded with the first peak for the laboratory-based surveillance (Figure 20). Some activity was detected by Webbsök during the second influenza wave, but at a very low level.
Figure 19. Webbsök’s estimated proportion of the population with ILI per week, 2021–2022.
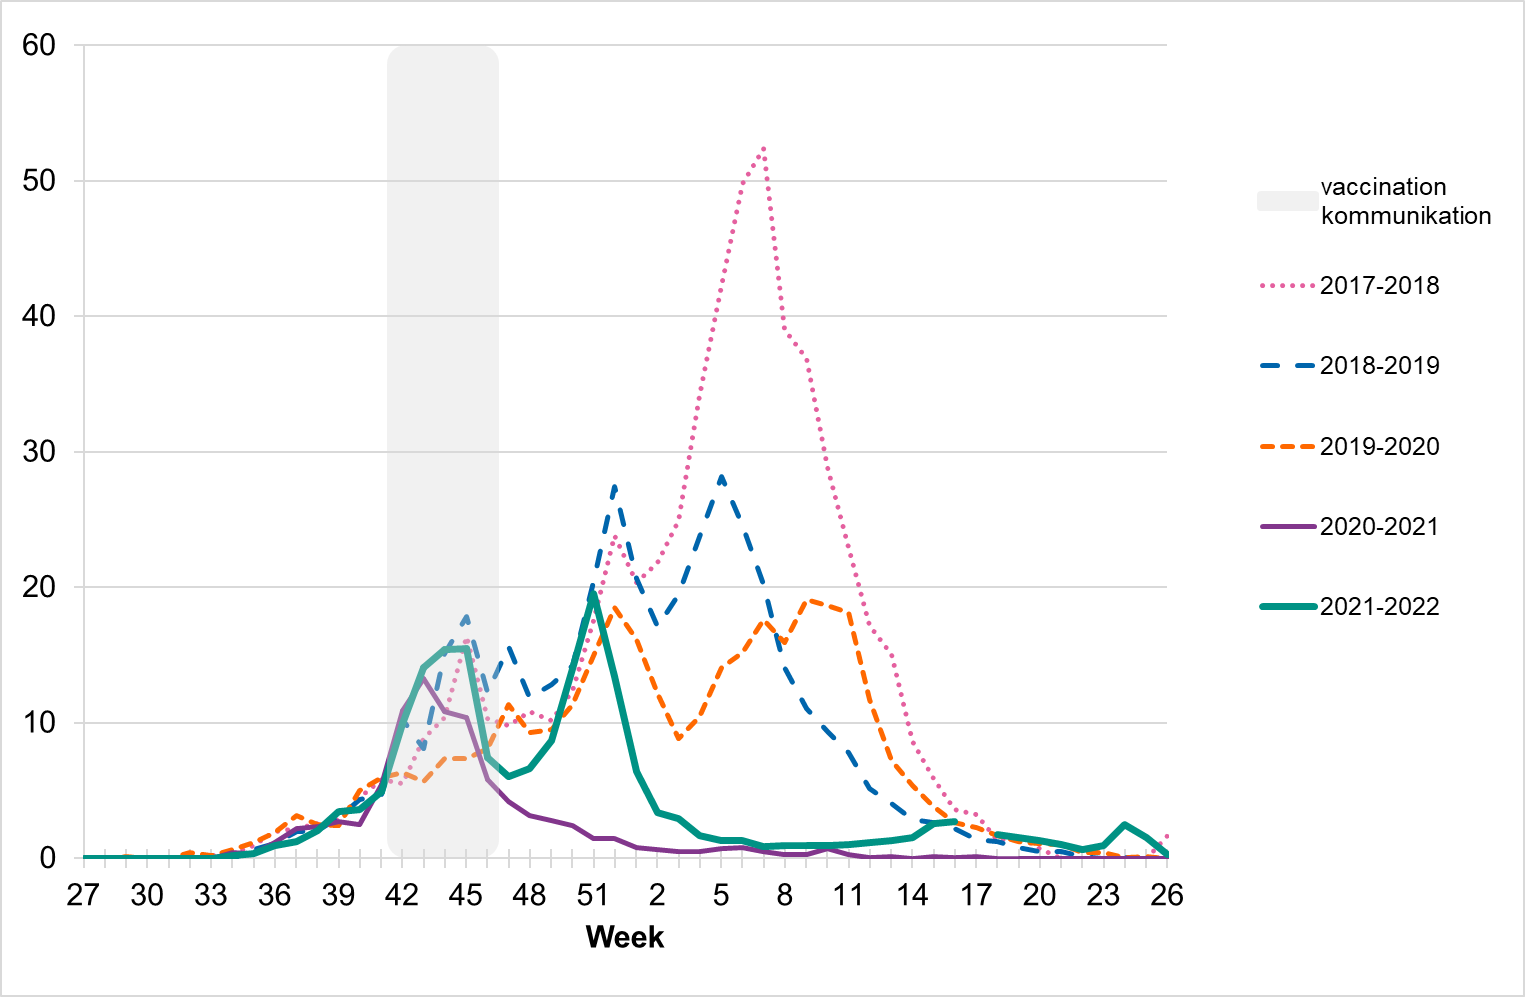
Note that the increased levels during weeks 42–46 (grey period) some seasons are deemed due to searches related to influenza vaccination rather than increased influenza activity. The statistical model is sometimes affected by intensive media coverage and other factors that change how people search for information on 1177.se. Webbsök should therefore be interpreted with some caution and seen as a complement to the PHAS’s traditional monitoring methods (e.g., laboratory-based and sentinel surveillance).
Figure 20. Webbsök’s estimated proportion of persons with ILI (incidence per 100,000 population) and the number of laboratory-confirmed cases, 2021–2022.
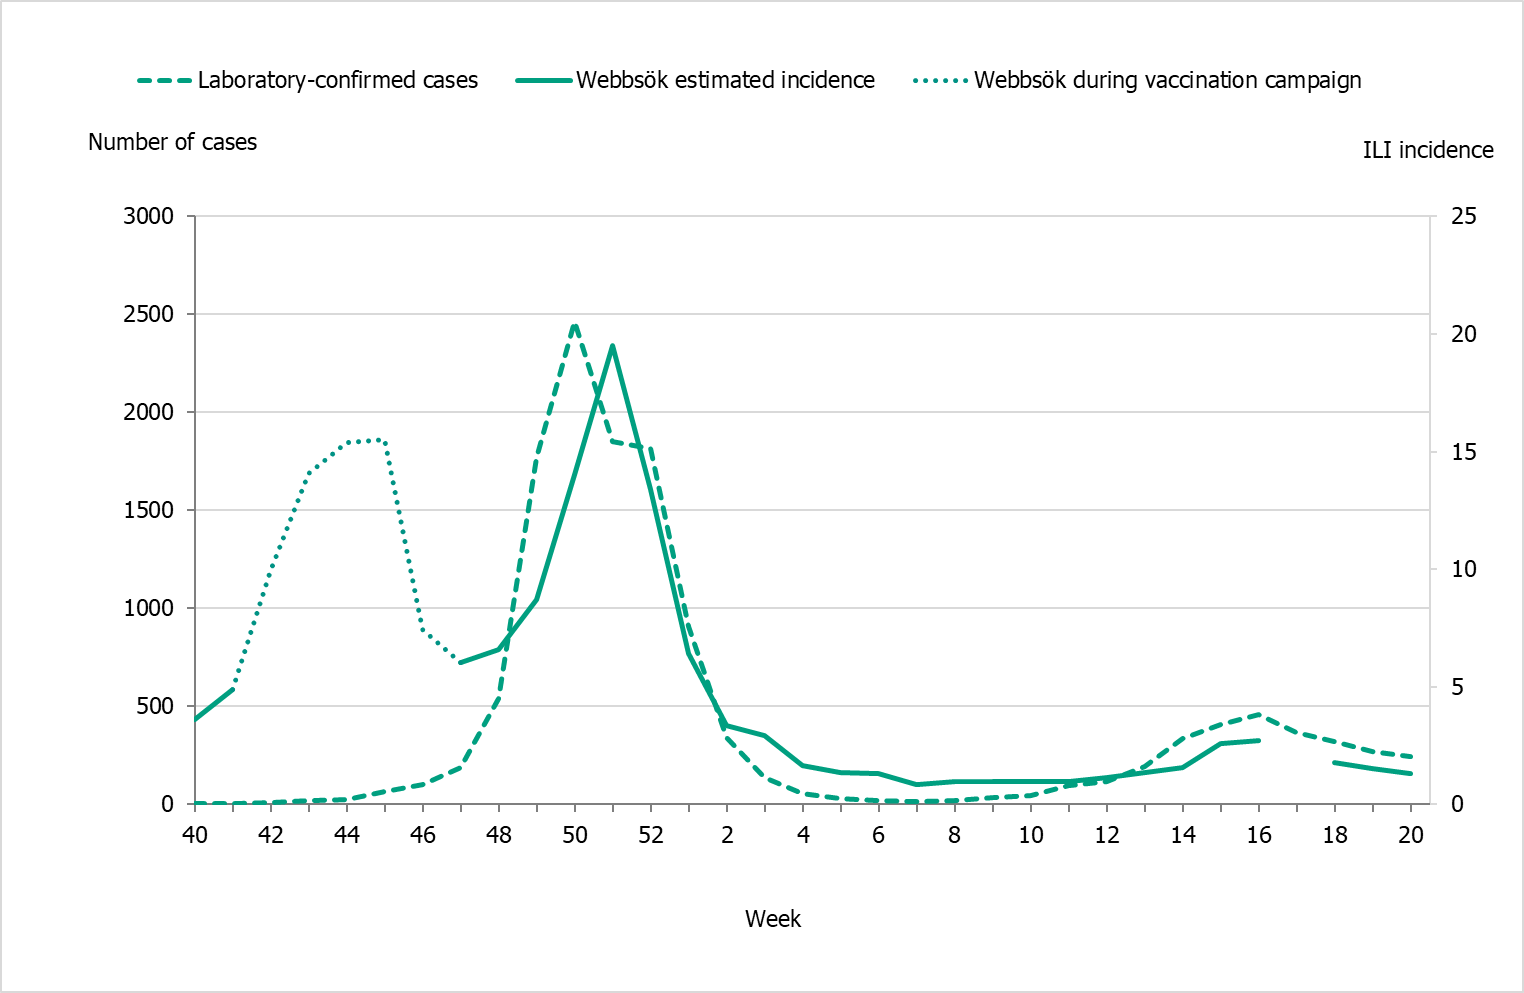
Note that during week 17 there was a technical error.
Telephone advice line data (1177 Vårdguiden)
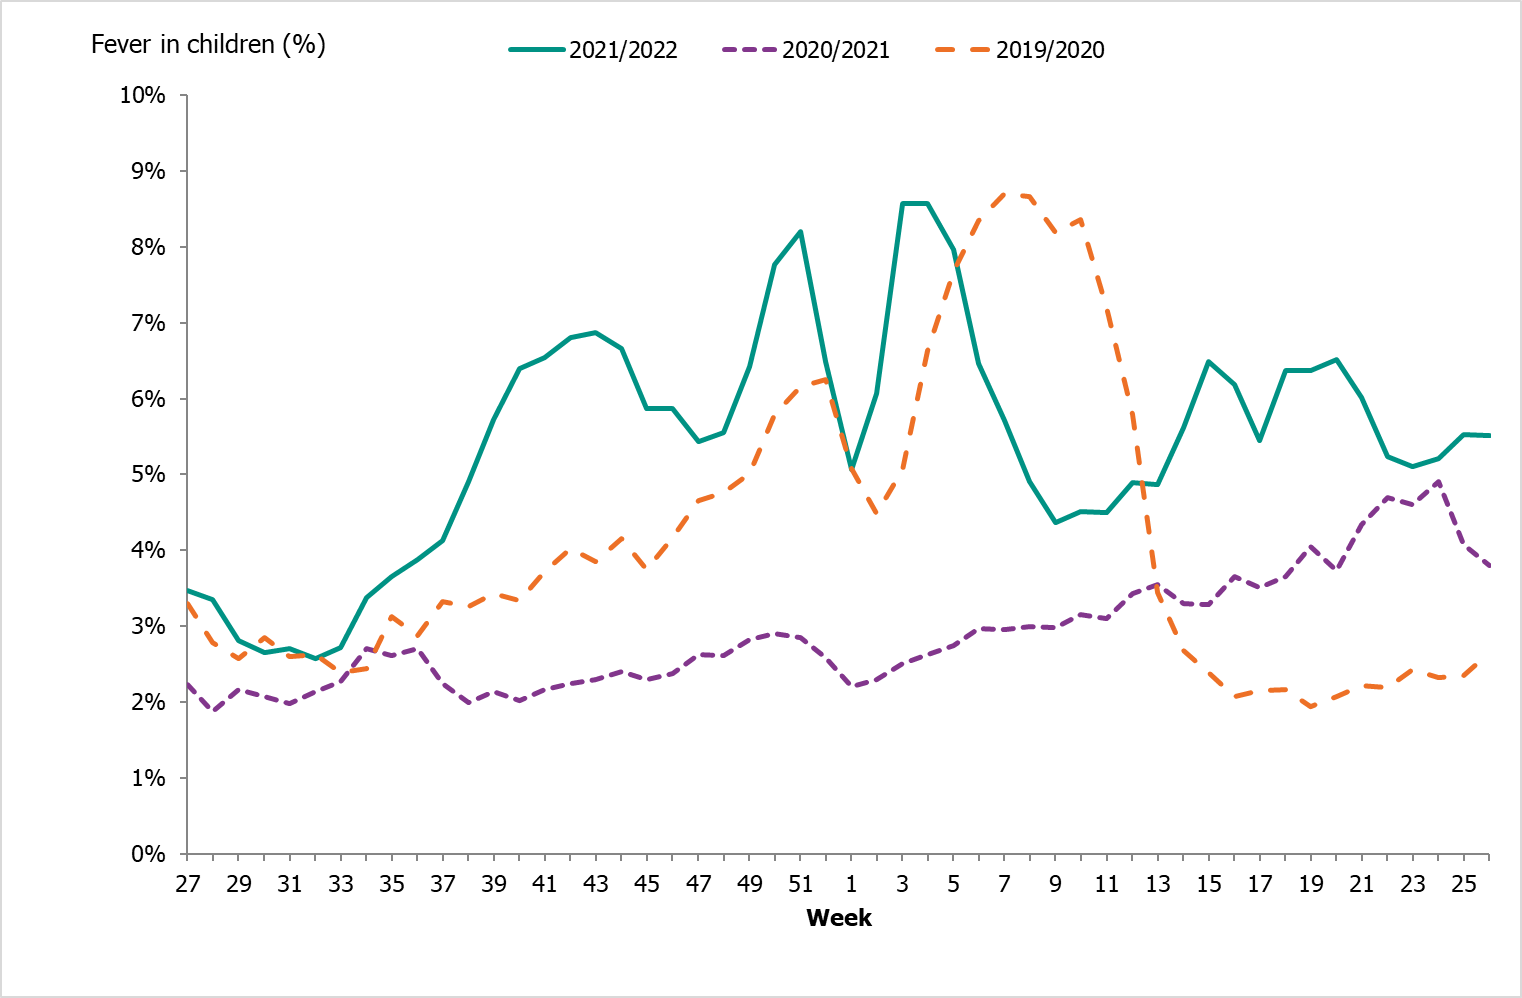
The percentage of calls to 1177 Vårdguiden regarding fever in children exceeded the epidemic threshold in week 39. The percentage of calls regarding fever among children was at a low level for most of the season but reached a medium level during week 51, 2021, and week 3 and 4, 2022, at around 8 percent. During the second wave of the influenza season, the percentage of calls regarding fever among children varied between 4.5 and 6.5 percent, with the highest levels in weeks 15–16 and 18–20. Fever among children is a non-specific indicator and can be due to causes other than influenza, not least COVID-19.
An average of 6.6 percent of the calls throughout the surveillance season (weeks 40–20) were regarding children with fever (Figure 21). This was higher than the previous season when this figure was 2.9 percent. The highest number of calls in a calendar week was 3,299 calls in week 4, 2022, which was higher compared to the previous season’s highest peak (1,710 calls). This was during the peak of the omicron variant of COVID-19 in Sweden. The highest percentage of calls this season was 8.6 percent (compared to 4.1 percent last season) and was registered during weeks 3-4, 2022. A noticeable peak in calls is often seen around the Christmas holidays every year, followed by a drop. The reason for this pattern might be decreased access to face-to-face healthcare services during the holidays leading to an increase in telephone consultations.
Figure 21. Percentage of telephone calls regarding fever in children received by the medical advice line 1177 Vårdguiden for the past three seasons.
Quality assessment
External quality assessment programmes provide a comparison of method performance between laboratories and are a tool to ensure accurate laboratory testing. The PHAS takes part in several external programmes and produces a panel for other Swedish laboratories. Surveillance is dependent on such standardised methods.
At the PHAS, one-step real-time RT-PCR assays are used detect influenza A and B, to subtype influenza A positive samples, and to discriminate between the two influenza B lineages. These assays have also been optimized, implemented, and evaluated for avian influenza diagnostics. This is essential because these assays are sensitive, rapid, and can be scaled up if necessary. The PHAS continuously monitors the genomic sequences of circulating influenza strains in order to detect mutations that could affect the sensitivity of our PCR assays. The PHAS also performs in silico (computational) validation of each assay twice a year, both before and during the peak of influenza season.
Every year the PHAS produces a PCR panel for Swedish laboratories on behalf of the External Quality Assessment for Clinical Laboratory Investigations (EQUALIS). This allows laboratories to measure the analytical sensitivity and specificity of their methods. The majority of the laboratories performing diagnostics for influenza use commercial PCR kits. A number of these laboratories participate in additional quality controls during the season in order to ensure that circulating influenza strains are detected with these kits.
National quality assessment programme for influenza PCR
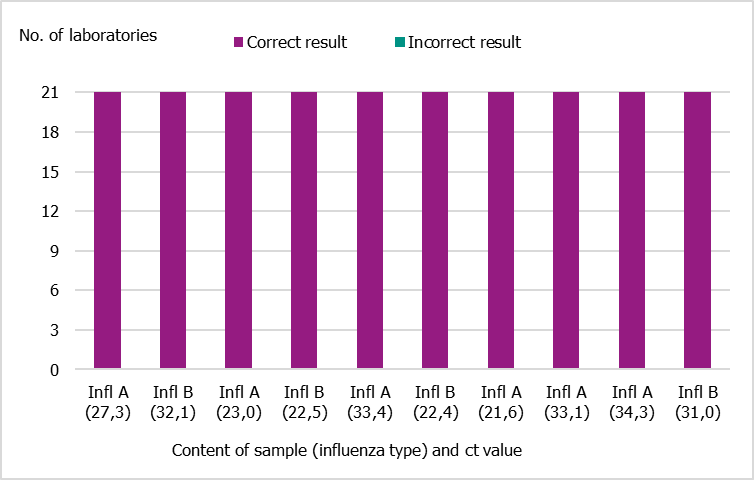
In September 2021, the PHAS produced a new PCR panel for Swedish laboratories, which was distributed by EQUALIS. Twenty-one laboratories participated in the panel, and all of them reported 10/10 correct results (Figure 22).
Figure 22. Results of the Swedish External Quality Assessment panel 2021.
Control of commercial PCR kits
Commercial PCR kits for influenza detection are widely used for diagnostic purposes. Each fall, ahead of the influenza season, a survey is conducted to determine which PCR kits are used by Swedish clinical microbiology laboratories. The survey also presents the option to participate in a panel in order to ensure that the PCR kits that are used are able to detect current circulating influenza strains.
For the 2021–2022 season, the survey was distributed to 24 different laboratories, of which 22 replied. All responding laboratories used commercial PCR kits. Of these 22, 15 reported using more than one commercial kit, and 3 used both commercial kits and in-house PCR detection.
Eight laboratories, using in total 13 different commercial PCR kits, were selected to receive the panel.
The following kits were evaluated:
- GeneXpert® Xpress SARS-CoV-2/Flu/RSV (Cepheid)
- NeuMoDx Flu A-B/RSV/SARS-CoV-2 Vantage Test (NeuMoDx, Qiagen)
- InflA/InflB/RSV/(SARS-CoV-2) (Alinity)
- VitaPCR™ (SARS-CoV-2)/Flu A/B & RSV* (Credo Diagnostics)
- Biofire® FilmArray (BioMerieux)
- Panther Fusion (Hologic)
- Seegene Allplex SARS-CoV-2/FluA/FluB/RSV
- BD-MAX Viasure SARS-CoV-2, Flu(A+B) & RSV
- Simplexa™ Flu A/B & RSV Direkt (DiaSorin)
- BD SARS-CoV-2/Flu for BD MAX™ System
- GenomEra SARS-CoV-2, Flu A/B+RSV kit (Abacus Diagnostica)
- LightMix ModularDx kit (TIB Molbiol/Roche)
- QIAstat-Dx Respiratory SARS-CoV-2 Panel (Qiagen)
A summary was presented on the PHAS website in order to inform other laboratories about the results.
In the event of methodological issues with clinical samples, Swedish clinical microbiology laboratories are welcome to contact the PHAS to compare their results or to obtain sequence data for further investigation.
External quality assessment programmes
The PHAS participated in two external quality assessment programmes during 2021. The results are summarised below.
Annual WHO External Quality Assessment Programme for influenza
The PHAS participated in the annual WHO External Quality Assessment Panel for influenza (no. 20) during 2021.
Molecular detection, typing, sub/lineage-typing
Ten samples analysed by real-time PCR were correctly typed (A, B, or negative). Seven of these were influenza A, with subtypes A(H1)pdm09, A(H3), A(H5), and A(H7) detected. Two influenza A samples could not be subtyped with real-time PCR, but whole-genome sequencing suggested they were subtype A(H9), and this was confirmed in the final report. This procedure follows the routine protocol at the PHAS in cases where Influenza A subtype cannot be established and where virus titres are high enough for further investigation.
Genotyping and phenotypic antiviral susceptibility determination
Genotyping analysis of the NA gene was performed by NGS on an Ion Torrent platform, and the results were correct for all three samples (two A(H1N1)pdm09 and one B/Yamagata) included in the programme. Phenotypic analysis was performed using a MUNANA-based NAI assay (fluorescence-based), and the results were correct for all three samples (same samples as above).
QCMD 2021 Influenza virus A and B RNA external quality assessment programme (21S)
Real-time PCR accurately detected the correct type, subtype, and lineage in all ten samples analysed. Subtyping and lineage typing identified influenza A(H1)pdm09, A(H3), B/Victoria, and B/Yamagata.
References
- Kissling et al. Influenza vaccine effectiveness against influenza A subtypes in Europe: results from the 2021–22 I-MOVE primary care multicentre study. Submitted 2022 to Influenza and Other Respiratory Viruses.
- Public Health Agency of Sweden. Publikationer [Publications]. [Internet]. Stockholm: Public Health Agency of Sweden; 2022 [cited 2022-08-29] Available from: http://www.folkhalsomyndigheten.se/publicerat-material/publikationer/
- Public Health Agency of Sweden, Aktuell influensarapport [Current Weekly Report]. [Internet]. Stockholm: Public Health Agency of Sweden; 2022 [cited 2022-08-02] Available from: https://www.folkhalsomyndigheten.se/folkhalsorapportering-statistik/statistik-a-o/sjukdomsstatistik/influensa-veckorapporter/
- Public Health Agency of Sweden, Sammanfattande rapport för säsongen 2021–2022 [Summary report for the 2021–2022 season]. [Internet] Stockholm: Public Health Agency of Sweden; 2022 [cited 2022-08-29] Available from: https://www.folkhalsomyndigheten.se/folkhalsorapportering-statistik/statistik-a-o/sjukdomsstatistik/influensa-veckorapporter/arkiv-20212022/
- Public Health Agency of Sweden, Current recommendations for influenza vaccination of risk groups. [Internet] Stockholm: Public Health Agency of Sweden; 2021 [cited 2021-08-02]. Available from: https://www.folkhalsomyndigheten.se/publicerat-material/publikationsarkiv/r/rekommendationer-om-influensavaccination-till-riskgrupper/
- World Health Organization, Recommended composition of influenza virus vaccines for use in the 2021–2022 northern hemisphere influenza season. [Internet]. Geneva: World Health Organization; 2021. [published 2021-02-26, cited 2022-08-29]. Available from: https://www.who.int/publications/m/item/recommended-composition-of-influenza-virus-vaccines-for-use-in-the-2021-2022-northern-hemisphere-influenza-season
- World Health Organization, Recommended composition of influenza virus vaccines for use in the 2022–2023 northern hemisphere influenza season. [Internet]. Geneva: World Health Organization; 2022. [published 2022-02-25, cited 2022-08-29]. Available from: https://www.who.int/news/item/25-02-2022-recommendations-announced-for-influenza-vaccine-composition-for-the-2022-2023-northern-hemisphere-influenza-season
- European Centre for Disease Prevention and Control/World Health Organisation Regional Office for Europe. Flu News Europe, Joint ECDC–WHO weekly influenza update, week 20/2022. [Published on 2022-05-31, cited 2021-08-29]. Available from: se http://flunewseurope.org/Archives
- Public Health Agency of Sweden, Webbsök för influensa [Web search for influenza] [Internet]. Stockholm: Public Health Agency of Sweden; 2022 [cited 2022-08-29] Available from: https://www.folkhalsomyndigheten.se/folkhalsorapportering-statistik/statistik-a-o/sjukdomsstatistik/influensa-veckorapporter/webbsok-for-influensa/sasong-20202021/
